Manual
Contents
Introduction
The Nuclear Envelope is a double membrane system surrounding the nucleus of eukaryotic cells. It consists of two separate lipid bilayers, the outer and the inner nuclear membranes. A large number of proteins located at the Envelope have been identified, performing a wide variety of functions, from the bidirectional exchange of molecules between the cytoplasm and the nucleus and the correct positioning of the nucleus in the cell to chromatin tethering, genome organization, regulation of signaling cascades and even transporting enormous cargo. In fact, it is already prominent that the complexity of the Nuclear Envelope rivals that of the plasma membrane.
NucEnvDB is a publicly available database of Nuclear Envelope proteins and their interactions. The database currently contains information on 3195 manually annotated proteins with known presence in the Nuclear Envelope, obtained from 427 species. Each database entry contains useful annotation including a detailed description of the protein's subcellular location, its position in the Nuclear Envelope, its interactions with other proteins and cross-references to major biological repositories.
Through the NucEnvDB web interface, users can perform simple or advanced text searches, as well as BLAST and HMMER queries against the database's protein sequences and domains. Furthermore, they can create, analyze and export protein-protein interaction networks from the database's components, using a specially designed network preparation pipeline that applies Cytoscape.js and the Markov Clustering algorithm (MCL). Finally, they can perform functional enrichment analysis on database components using WebGestaltR, an R implementation of the WEB-based Gene SeT AnaLysis Toolkit (WebGestalt). The entire database is available for download in text, FASTA and XML formats.
NucEnvDB is currently the only available repository focused on the Nuclear Envelope and its protein components. Given the rising interest in studying the Nuclear Envelope, a previously unattended subcellular component, we expect NucEnvDB to be a valuable resource for genome-wide and/or proteome-wide analyses and, potentially, the design of novel prediction algorithms aimed at Nuclear Envelope proteins.
Browsing NucEnvDB
You can browse NucEnvDB's contents through the website's "Browse" menu in four different manners: By Proteins, Envelope Locations, Organisms and Ontology terms.
- Proteins: The database's protein entries.
- Envelope Locations: The subcellular locations associated with the Nuclear Envelope.
- Organisms: All organisms with protein entries in NucEnvDB.
- Ontology Terms: Gene Ontology terms associated with proteins in the Nuclear Envelope.
Browse Proteins
By choosing "Browse->Proteins" from the website's "Browse" menu, you will be redirected to the following page:
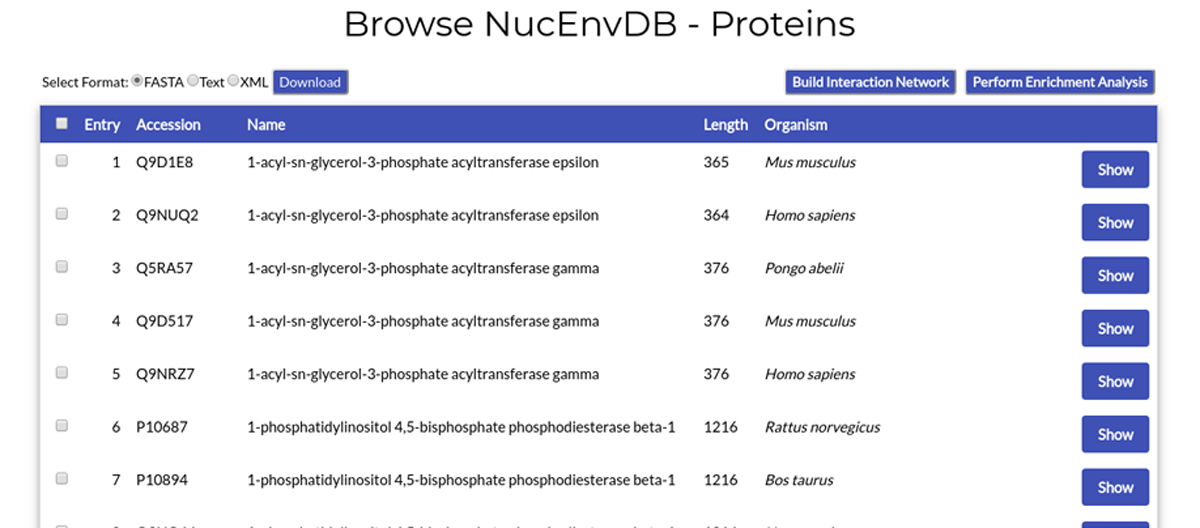
Each table line corresponds to a NucEnvDB protein entry. The entry's index number, accession code (corresponding to the protein's UniProt accession number), protein name, sequence length and source organism are given. By clicking the "Show" button, you will be redirected to the protein's Entry page.
You can select multiple entries at once by clicking their checkboxes, appearing at the start of each line. By clicking the checkbox in the table's head line, you can select all entries at once. Selected entries can then be downloaded or used to perform Interaction Network and/or Enrichment analysis.
At the top left corner of the page's table, you can see the available options for download. By selecting an appropriate format (FASTA, Text, or XML) and clicking the "Download" button, you can download your selected entries in any of the three file formats.
At the top right corner of the page's table, you can see buttons for two analysis options, "Build Interaction Network" and "Perform Enrichment Analysis". Each of those buttons will redirect you to the respetive tool pages, to prepare and perform Network Analysis and/or Functional Enrichment on the entries you have selected (see Sections 8 and 9 of this manual).
Browse Envelope Locations
By choosing "Browse->Envelope Locations" from the website's "Browse" menu, you will be redirected to the following page:
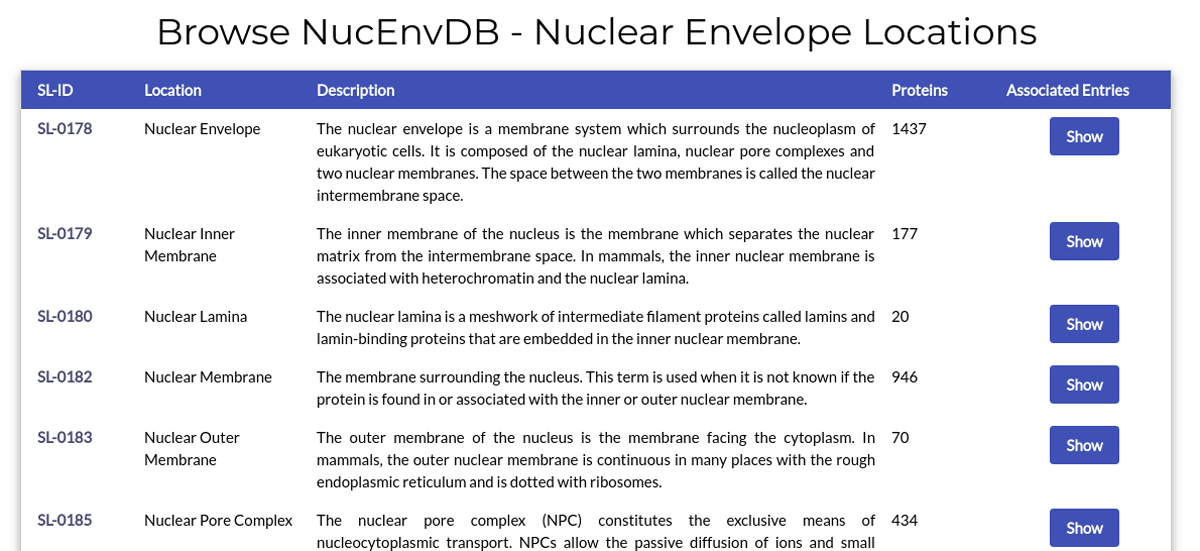
The page lists all subcellular locations associated with the Nuclear Envelope.
Each table line corresponds to a Nuclear Envelope position. For each position, the subcellular location's name, code (SL-ID), description and number of associated NucEnvDB entries are given. Clicking on the SL-ID code will redirect you to the location's page in UniProt. Clicking on the "Show" button will retrieve all NucEnvDB entries associated with this particular location.
Browse Organisms
By choosing "Browse->Organisms" from the website's "Browse" menu, you will be redirected to the following page:
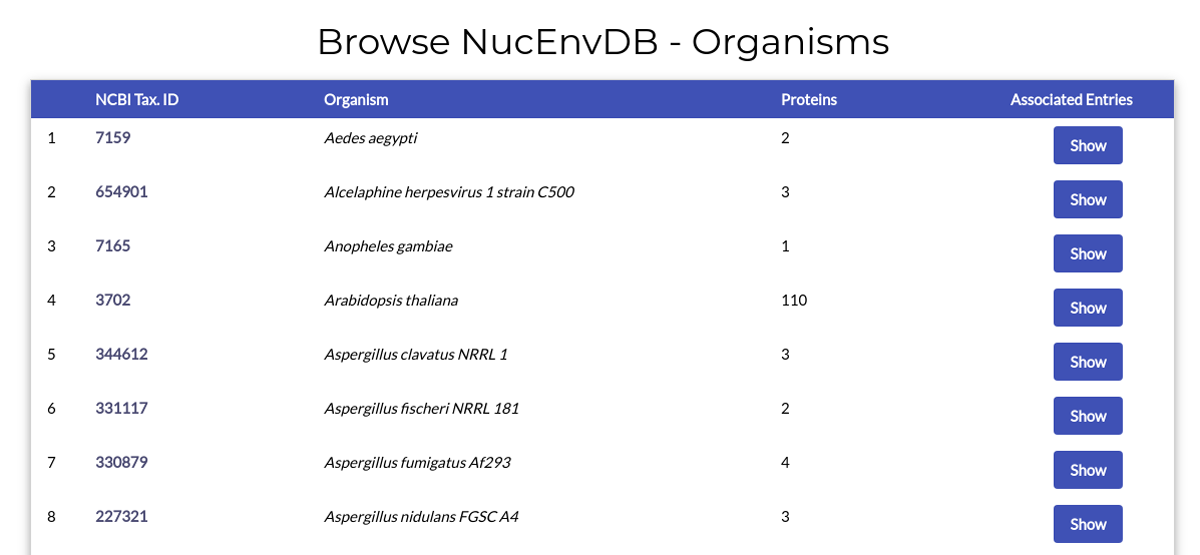
The page lists all organisms with protein entries in NucEnvDB.
Each line corresponds to an organism. For each organism the species name, NCBI taxonomy ID (NCBI Tax. ID) and number of associated NucEnvDB entries are given. By clicking the organism's Tax. ID you will be redirected to its equivalent page in the NCBI Taxonomy Browser. By clicking the "Show" button you will retrieve all of the organism's protein entries in NucEnvDB.
Browse Ontology Terms
By choosing "Browse->Ontology Terms" from the website's "Browse" menu, you will be redirected to the following page:
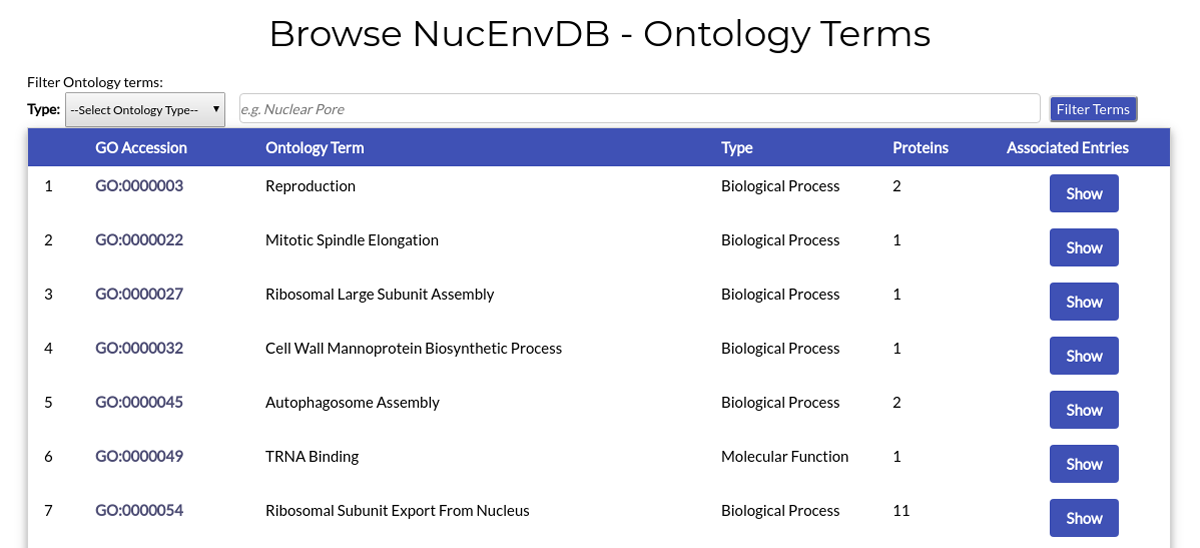
The page lists all Gene Ontology terms that have been assigned to Nuclear Envelope proteins deposited in NucEnvDB.
Each table line corresponds to an ontology term. For each term its name, type, Gene Ontology (GO) ID and number of assocated NucEnvDB entries are given. By clicking on the term's GO ID you will be redirected to its page in the Gene Ontology database. By clicking the "Show" button you will retrieve all NucEnvDB entries associated with this particular term.
Due to the large number of Ontology terms, additional options for filtering are given at the top of the page. You can filter ontology terms by choosing their type (Biological Process, Molecular Function or Cellular Component) through the "Select Ontology Type" dropdown and/or by entering custom terms in the accompanying text box area. Two examples follow:
Example 1. Retrieve all Cellular Component terms:
You can retrieve all Terms assigned as "Cellular Component" simply by choosing "Cellular Component" from the dropdown menu and then clicking "Filter Terms":
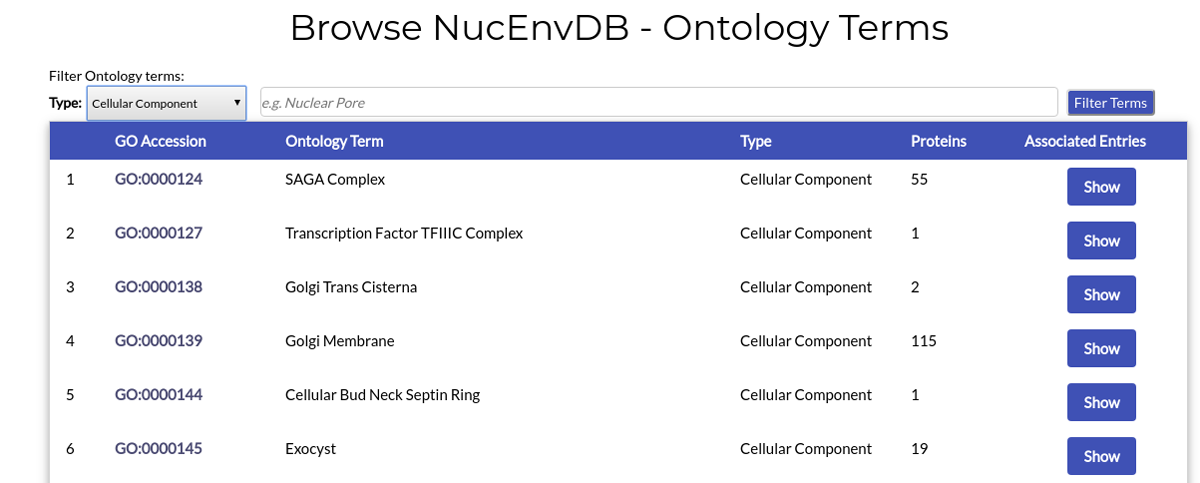
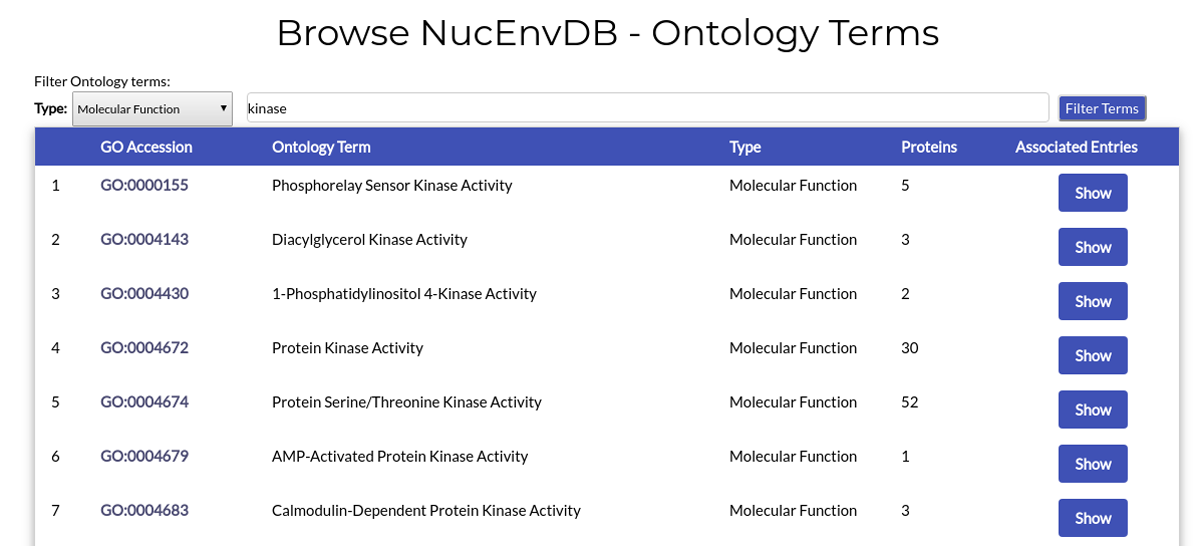
Example 2. Retrieve all Molecular Function terms related to kinase activity:
You can retrieve all Terms assigned as "Molecular Function" and associated with "kinase activity" by choosing "Molecular Function" from the dropdown menu, combining it with an additional "kinase" keyword in the text box area and then clicking "Filter Terms":
NucEnvDB Entries
An example of a NucEnvDB entry is given below for human Nucleoporin p54 (Q7Z3B4):
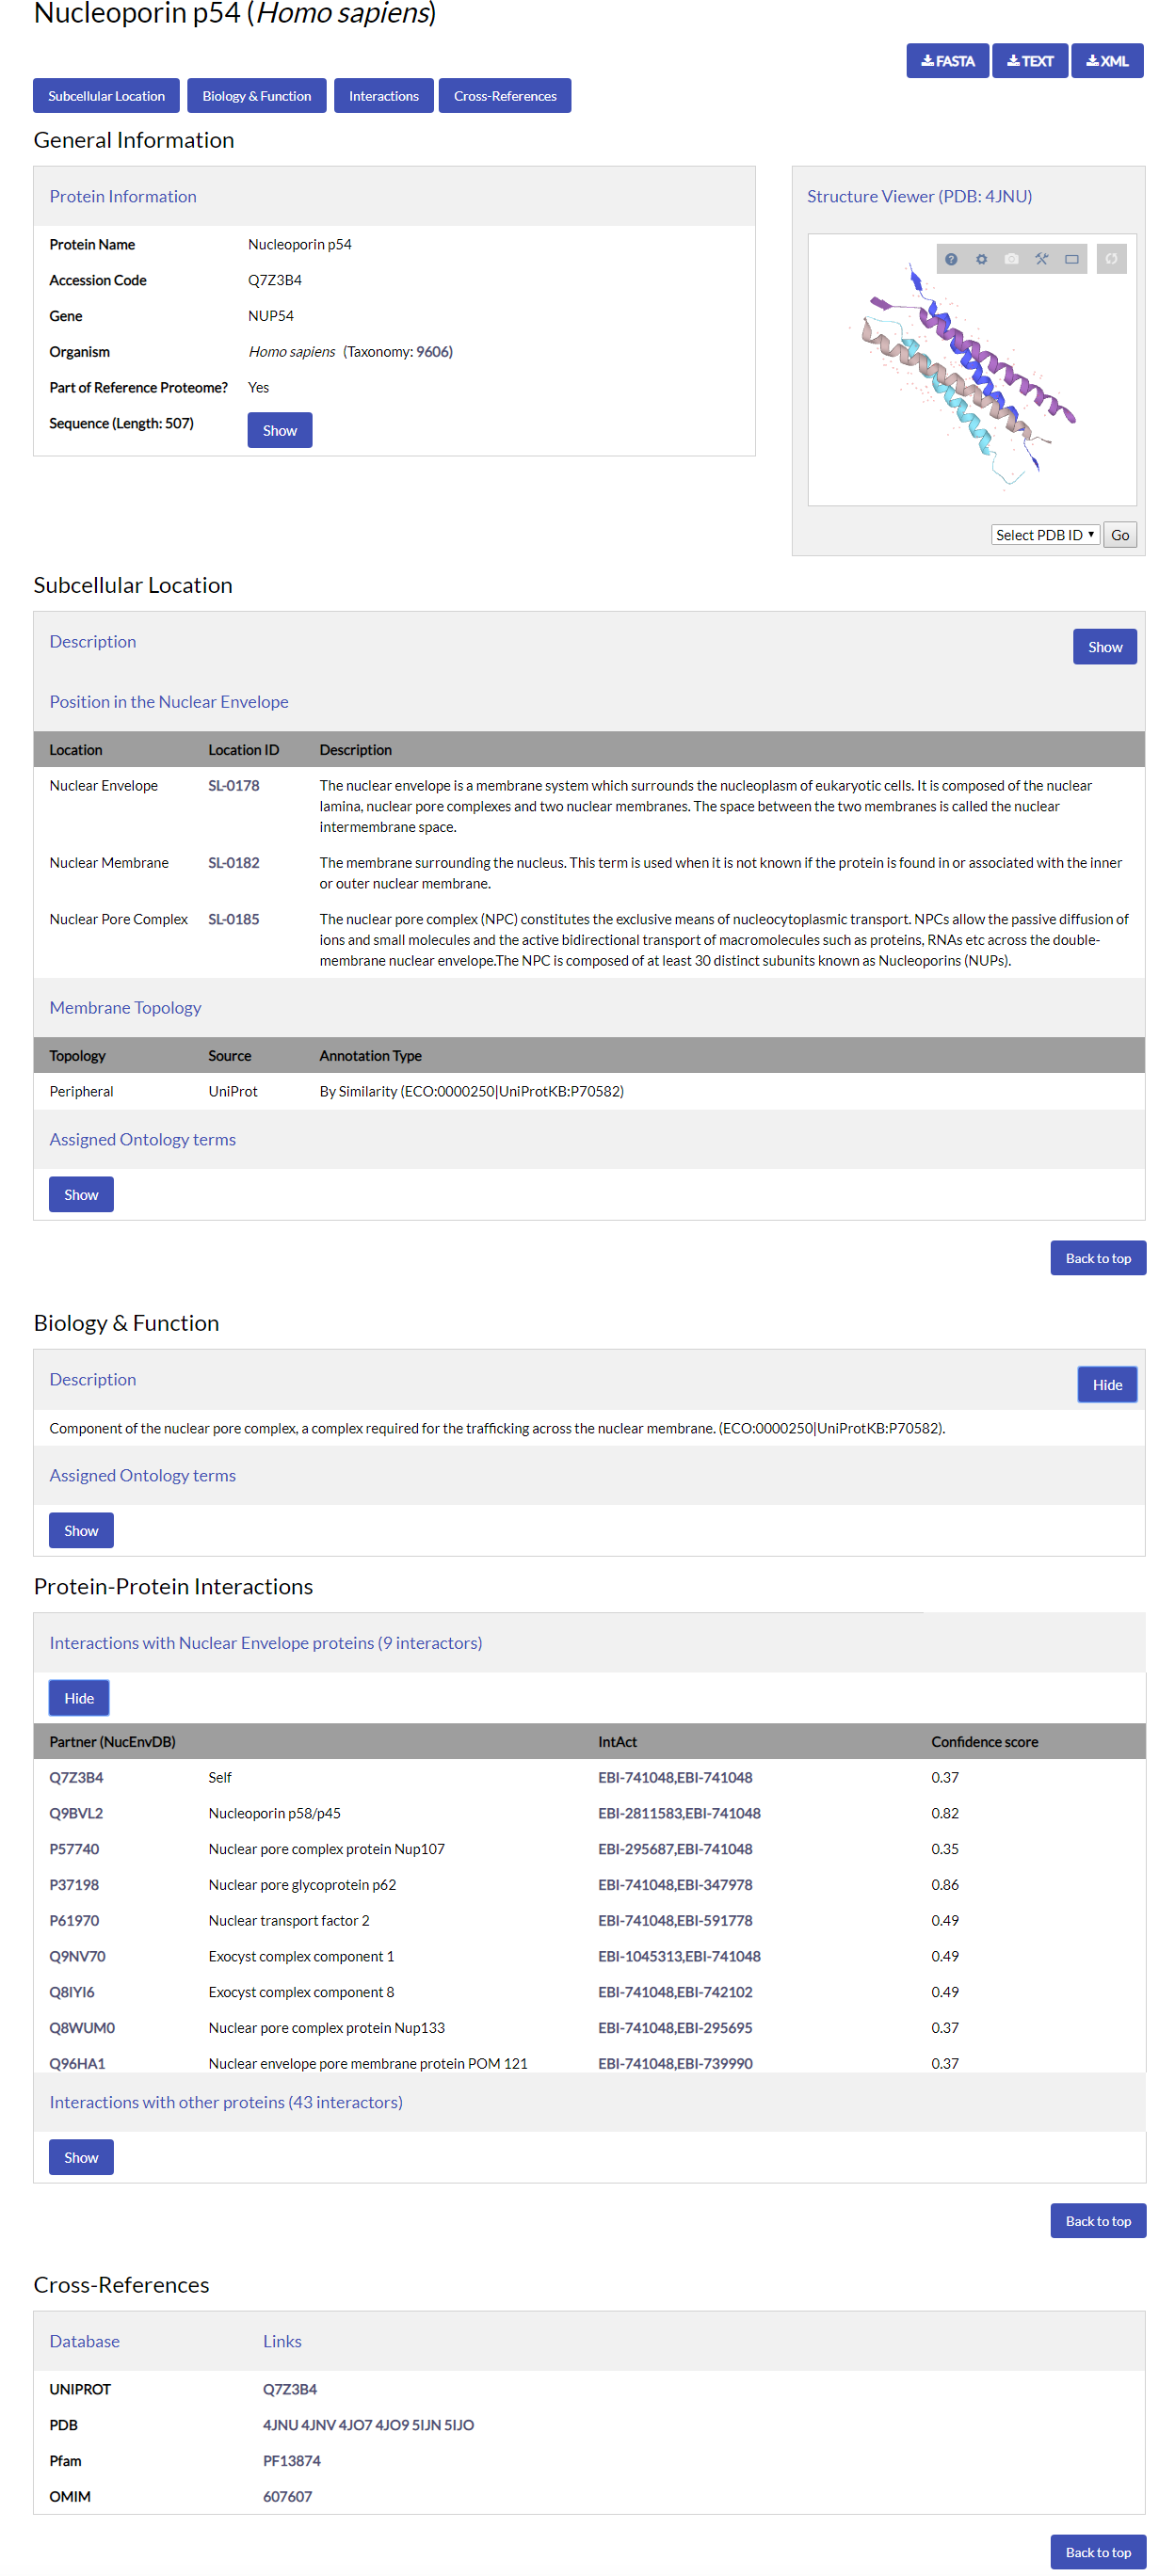
A short description of each entry field follows:
Download buttons
At the top of the page you will find three buttons, termed "FASTA", "Text" and "XML". By clicking on them you can download the entry in each respective file format.
Section Links
Immediately following the entry's title follow buttons that link to the entry's different sections, namely, "Subcellular Location", "Biology & Function", "Interactions" and "Cross-References". Click any button to automatically move to the respective section. You can return to the top of the page at any time by scrolling up, or by clicking the "Back to Top" button at the end of each section.
General Information
The General Information field holds the entry's basic protein identification features, namely:
- Protein Name
- Entry Accession Code
- Gene Name
- Source Organism (Species name and NCBI Tax. ID)
- Information on whether this protein is part of a reference proteome.
- The protein's amino acid sequence. This can be shown on hidden by clicking on the "Show" button.
Structure Viewer
For proteins with known three-dimensional structures, an additional structure viewer is provided alongside protein information, implemented using the LiteMol molecular viewer. An interactive example is shown below:
Structure Viewer controls
- Choose which structure you would like to view by selecting its PDB ID from the "Select PDB ID" dropdown and clicking the "Go" button (disabled in this page).
- Hold the left mouse button and move the mouse to rotate the structure in the viewer.
- Hold the right mouse button and move the mouse up and down to zoom the out and in.
- Hold the middle (scroll) mouse button and move the mouse to move the structure in the viewer.
- If you hover the mouse over any part of the structure, it will be highlighted and the residue's name, number and chain will appear on the top left corner of the viewer.
- If you left- or right-click any part of the structure the viewer will zoom in that region. The segment you clicked and its surrounding residues will appear in ball and stick representation.
- The top right corner of the viewer contains LiteMol's toolbar (Help, Scene Options, Screenshot, Show/Hide Controls, Expand/Collapse, Reset Scene). Hovering the mouse over any of the buttons displays their name. Left-clicking on them opens the appropriate menu.
Structure Viewer (PDB: 4JNU) |
|---|
Subcellular Location
The Subcellular Location field holds information on the protein's localization inside the cell.
- The Description field shows general information on the subcellular locations the protein has been associated with. These may include both locations in the Nuclear Envelope and other parts of the cell, since many proteins can be present in different subcellular locations throughout their lifetime, depending on their functional state, the cell type or stage of the cell cycle. If available, additional annotation for each subcellular location is given in the form of Evidence & Conclusion Ontology (ECO) codes, associated UniProt entry codes or PubMed IDs. The description can be revealed or hidden by clicking on the "Show/Hide" button.
- The Position in the Nuclear Envelope field shows the Nuclear Envelope locations in which the protein has been found. The name, SL-ID and description of each location are offered.
- The Membrane Topology field shows the topology of the protein with respect to the membrane. In addition, the annotation source and type of evidence are given.
- The Assigned Ontology Terms field shows all Gene Ontology Terms (Type: Cellular Component) that are associated with the protein's subcellular location. These can be revealed or hidden by clicking on the "Show/Hide" button.
Biology & Function
The Biology & Function field holds information on the protein's functional features.
- The Description field gives information on the protein's function. Similar to Subcellular Location, additional annotation may be given, if applicable, through Evidence Code Ontology assignments. The description can be revealed or hidden by clicking on the "Show/Hide" button.
- The Assigned Ontology Terms field shows all Gene Ontology Terms (Types: Biological Process and Molecular Function) that characterize the proteins function. These can be shown on hidden by clicking on the "Show/Hide" button.
Protein-Protein Interactions
For proteins known to participate in interactions, this field shows all binary interaction pairs, as retrieved from the IntAct database. For each protein pair, the partner's accession code, a link corresponding to the interaction's page in IntAct and a confidence score are given.
Depending on the partner's location in the cell, these interactions are divided in two groups:
- Interactions with Nuclear Envelope proteins: complexes between the entry's protein and other proteins of the Nuclear Envelope.
- Interactions with other proteins: complexes between the entry's protein and partners from other parts of the cell.
The "confidence score" offered is IntAct's Molecular Interaction Score (intact-miscore), a measurement of each interaction's reliability. Score values range from 0.0 to 1.0, with higher values corresponding to more reliable interaction evidence. For more information on how this score is calculated, please refer to the IntAct manual at EMBL-EBI.
Cross-References
This field provides cross-references for the protein to other major biological repositories. Depending on their availability for each protein, these include UniProt, PDB, Pfam, PROSITE, OMIM and DiseGeNET.
Explanation of the NucEnvDB downloadable file formats
As already stated, the top of each entry page contains link to downloadable versions of the entry in three formats, FASTA, TEXT and XML. An explanation of each file format follows:
FASTA formatThis is the standard FASTA format used for biological sequences. The first of the file is the title, starting with the ">" symbol. The following lines contain the amino acid sequence in the one-letter code.
TEXT formatA flat-file text format, containing the Entry's entire information. Each line starts with a two-character identification string, representative of the respective field's information type. The format's fields are described below:
- ID: The ID of the entry in NucEnvDB.
- PN: Protein Name.
- GN: Gene Name.
- OS: The NCBI taxonomy ID of the species.
- SL: Subcellular location. This field is further divided in two subcategories:
- Nucleus Position: The protein's position in the Nuclear Envelope. The SL-IDs of the subcellular locations are given. Since a protein may be assigned to multiple positions, multiple "SL Nucleus Position" lines may exist.
- Description: A free-form text description of the protein's subcellular location, both in the Nuclear Envelope and in other compartments.
- DR: Cross-references to other databases. Each DR line corresponds to a cross-reference, therefore, multiple DR lines may exist. Cross-reference lines are given for UniProt, PDB, Pfam, PROSITE, OMIM and DisGeNET.
- DE: The Description field, which contains information on the protein's biology, function and interactions. This field is further divided in three subcategories:
- Function: contains a free-form text description of the protein's function.
- Reference Proteome: indicates whether the protein is assigned to a reference proteome in UniProt.
- Interaction: contains information on a binary protein-protein interaction. The information given includes the partner's UniProt Accession Number, the IntAct IDs of the two interactors and the value of the interaction's confidence score (intact-miscore).
- GO: Gene Ontology terms. Each line contains the GO ID of an assigned Ontology term. A protein may have multiple GO terms and, therefore, multiple GO lines.
- TP: The protein's topology with respect to the membrane. Information given includes the protein's type (Transmembrane/Peripheral/Lipid-anchored/Other) and the source of the annotation (Experimental Evidence, By Similarity, Curator Inference, Sequence Analysis).
- SQ: The SQ lines contain the amino acid sequence of the protein in the one-letter code in 80 character increments.
- //: The end of the Entry. In multiple-entry text files, the "//" characters can be used to split entries, when using regular expressions (e.g. with Perl).
An XML-encoded format, that can be used with compatible XML parser's (e.g. Python's XPath). The XML "tags" (i.e. fields) are very similar to the ones used in the Text Format and are given below:
- NucEnvDB: In multiple-entry XML files (including the XML version of the entire database offered in the Downloads page), the outer-most tag, containing all entries, is termed "NucEnvDB".
- Entry: Each protein Entry is contained in the "Entry" tag.
- ID: Contains the entry's ID.
- ProteinName: The protein's name.
- GeneName: The associated gene name.
- OS_id: The NCBI taxonomy ID of the organism.
- ReferenceProteome: Indicates whether the protein is assigned to a reference proteome in UniProt.
- SubcellularLocation: Contains the subcellular location information. The tag is further divided in subcategories:
- Location: Contains the SL-IDs of Nuclear Envelope locations assigned to the proteins. Multiple elements may exist for an entry.
- Comments: A free-form text description of the protein's subcellular location, both in the Nuclear Envelope and in other compartments.
- CrossReferences: A collection of all cross-references of the entry to other databases. The field contains multiple cross-reference assignments, each using a distinct "CrossReference" tag. Each "CrossReference" tag contains an "Database" tag, containing the database's name (UniProt, PDB etc) and an "id" tag, containing the protein's ID in the respective database.
- Function: Contains a description of the protein's function.
- Interactions: a collection of all binary interactions for the protein. The field contains multiple "Interaction" tags, each presenting the partner's UniProt AC with a "Partner" tag and the IntAct IDs with an "IntAct" tag.
- OntologyTerms: a collection of all Gene Ontology terms assigned to the protein. Each GO term is given with a disticnt "Ontology" tag.
- Topology: The protein;s topology with respect to the membrane. The tag is further divided in subcategories:
- Type: the topology type.
- Source: the source of the annotation.
- Annotation: the type of information used (Experimental Evidence, By Similarity etc).
- Sequence: Contains the protein sequence in a single field.
- SequenceLength: the protein sequence's length.
Searching NucEnvDB
You can perform simple, quick searches in NucEnvDB using the "Quick Search" form from the top menu:

Alternatively, if you want more precise results, you can use the "Advanced Search" form:
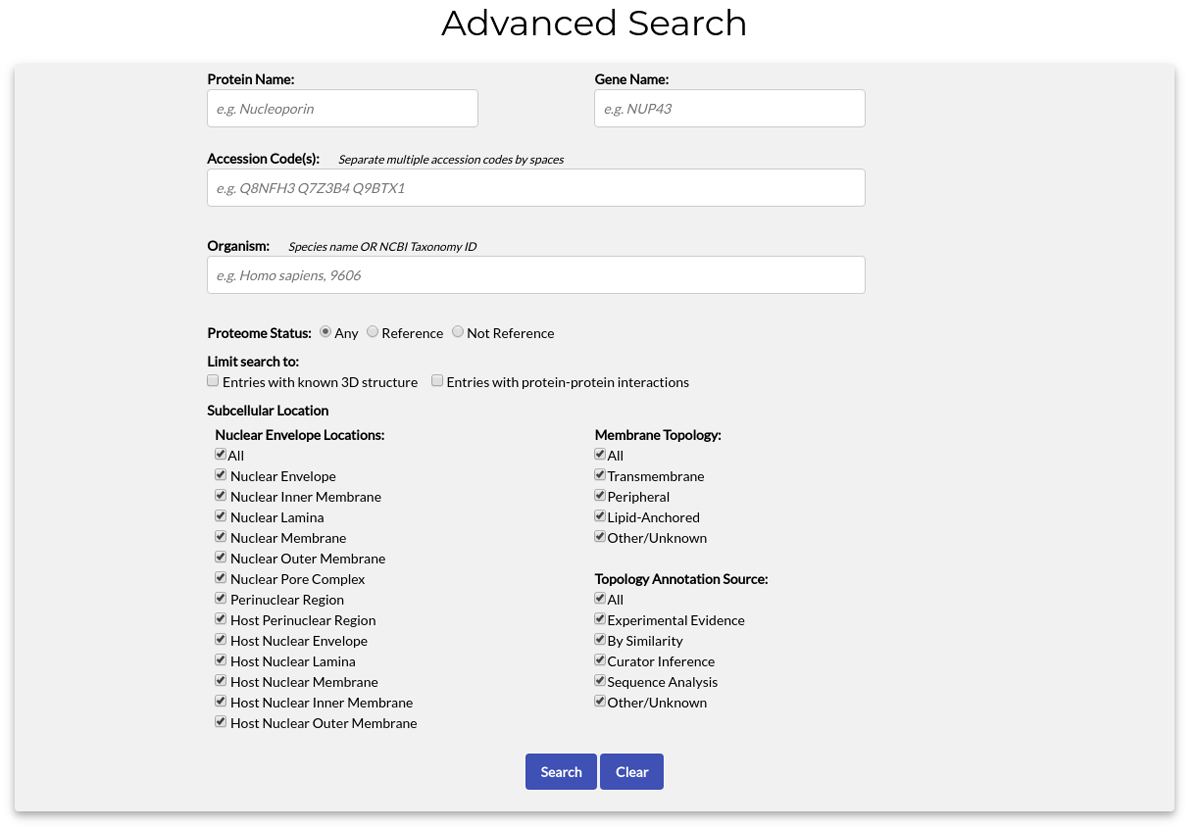
The available search options are:
- Protein Name (e.g. Nucleoporin p54)
- Gene Name (e.g. Nup54)
- Accession Code(s). One or multiple ACs may be entered, separated by spaces.
- Organism. Both species names (e.g. Homo sapiens) and NCBI Tax. IDs (e.g. 9606) may be used.
- Proteome status. You can search all proteomes, limit your search to Reference Proteomes only or search Non-Reference proteomes.
- Entries with know 3D structure. By checking this option only proteins at least one available structure in the PDB will be retrieved.
- Entries with protein-protein interactions. By checking this option only proteins with known interactions will be retrieved.
- Nuclear Envelope locations. Limit search to a specific location of the Nuclear Envelope. By default, all locations are selected. Note: By checking the "All" option, all locations are automatically selected.
- Membrane Topology. Limit search to entries with a specific topology. By default, all topology types are selected. Note: By checking the "All" option, all topology types are automatically selected.
- Topology Annotation Source. Search entries depending on the type of annotation for their topology. By default, all annotation sources are selected. Note: By checking the "All" option, all annotation sources are automatically selected.
Search results are presented in a page following the same format as the "Browse Proteins" page:
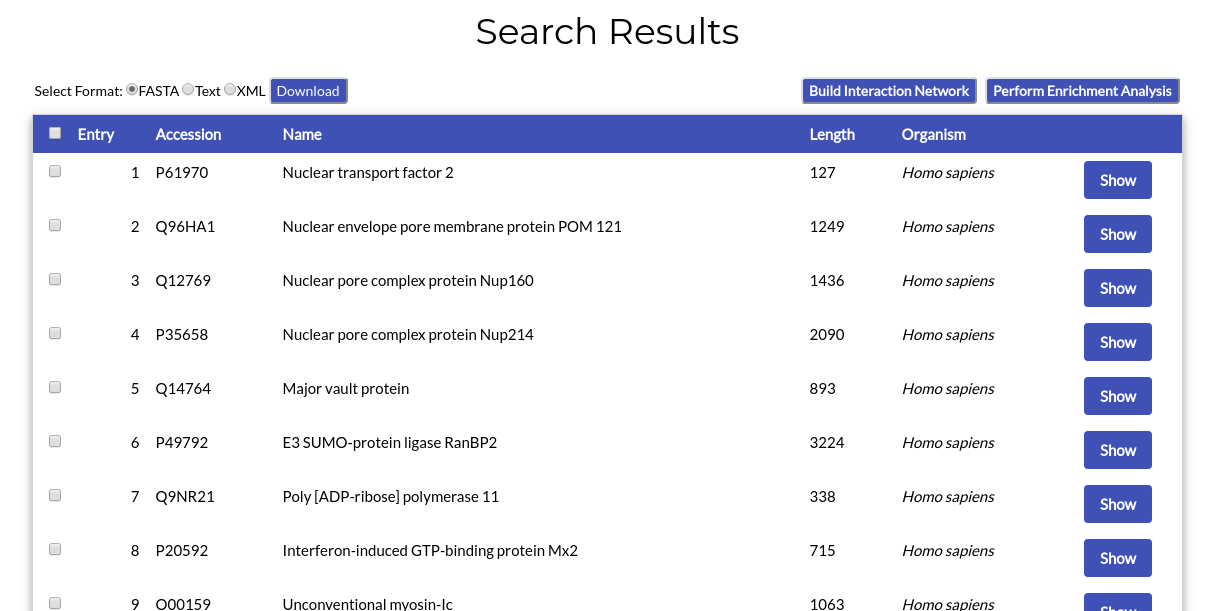
All functions available in the "Browse Proteins" page also apply to the search results.
BLAST Search
You can use the BLAST Search tool to submit one or more amino acid sequences and search NucEnvDB for finding homologues.
By choosing "Tools->BLAST Search" from the top menu you will be redirected to the following page:

To use the BLAST search tool you need to paste one or more sequences in FASTA format in the text box area. If you wish, you can also adjust the E-value threshold level. When you are ready, click the "Submit" button.
After the search is complete, you will be redirected to the BLAST results page:
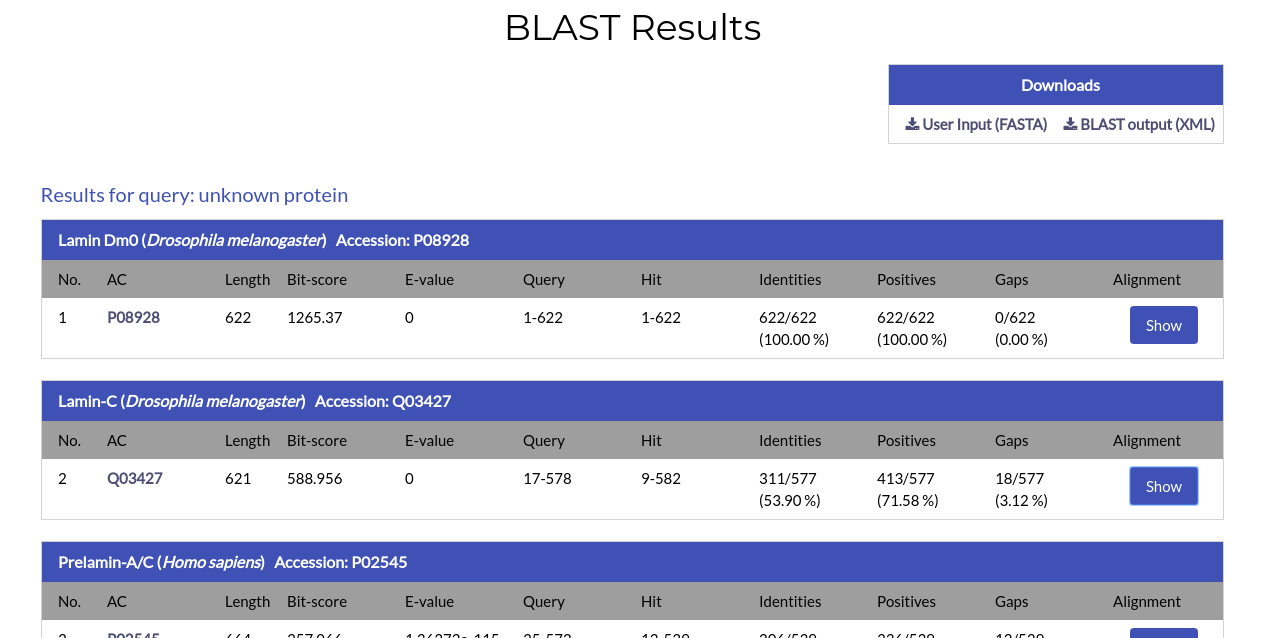
The result page of the BLAST search shows a list of the Blast hits with significant pairwise alignments on each query sequence you have submitted. In the top right of the page, you can download a file containing your input sequences, as well as a file with the results of the BLAST search in XML format.
For each alignment, the name, species and Accession Code of each sequence hit, its length, the sequence ranges of the aligned regions and a number of alignment metrics (Bit-score, E-value, Identities, Positives and Gaps) are given. By clicking on the hit sequences AC, you will be redirected to its respective NucEnvDB page. The pairwise alignment between the query and hit sequences can be shown by clicking the "Show" button under the "Alignment" column:
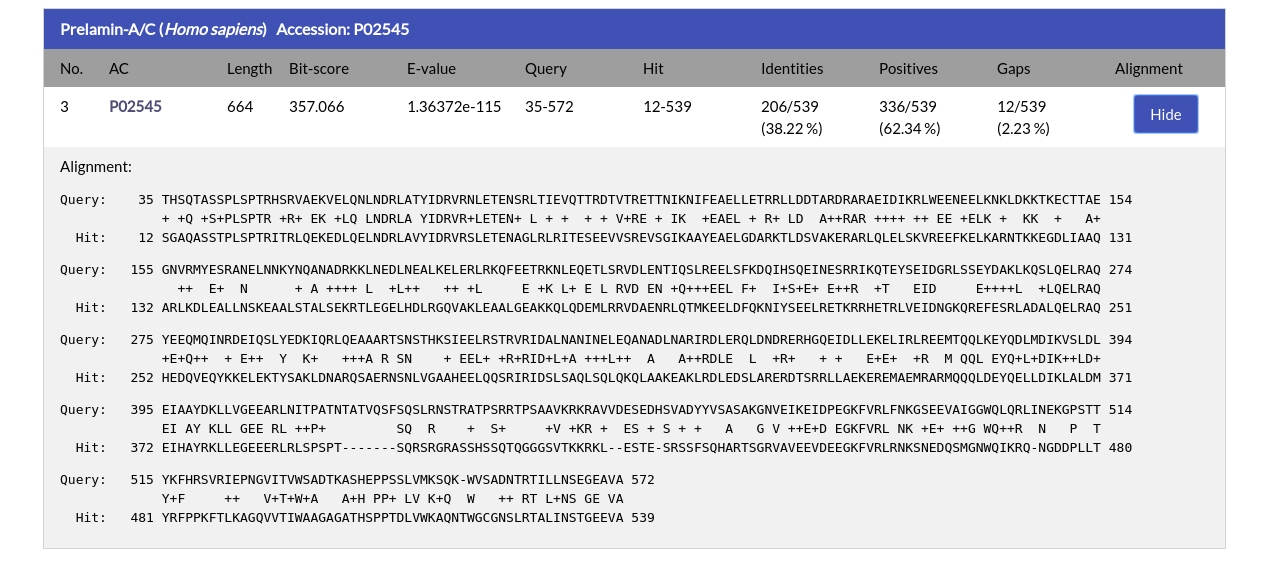
The alignment is presented in the standard BLAST output format.
HMMER Search
In addition to BLAST, NucEnvDB also offers the ability to perform sequence searches with HMMER. Using HMMER can be very useful in cases where you want to detect distant sequence homologues that are not easily identified with standard BLAST searches. In addition, through HMMER you can perform sequence searches against the domains of Nuclear Envelope proteins, as well as searches of domains (represented by profile HMMs) or multiple sequence alignments against NucEnvDB sequences.
HMMER Search is available by choosing "Tools->HMMER Search" from the top menu. In NucEnvDB, you can use three different HMMER search tools:
- PHMMER: Search one or more sequences against NucEnvDB's protein sequences
- HMMSCAN: Search one or more sequences against NucEnvDB's profile HMM database, containing domains appearing in Nuclear Envelope proteins
- HMMSEARCH: Search a profile HMM or a multiple sequence alignment against NucEnvDB's protein sequences
Each tool can be accessed from the menu at the top of the "HMMER Search" page:

PHMMER Search
With PHMMER you can submit one or more amino acid sequences and perform a search against NucEnvDB for finding homologues. If you choose "PHMMER" from the menu, you will see the following form: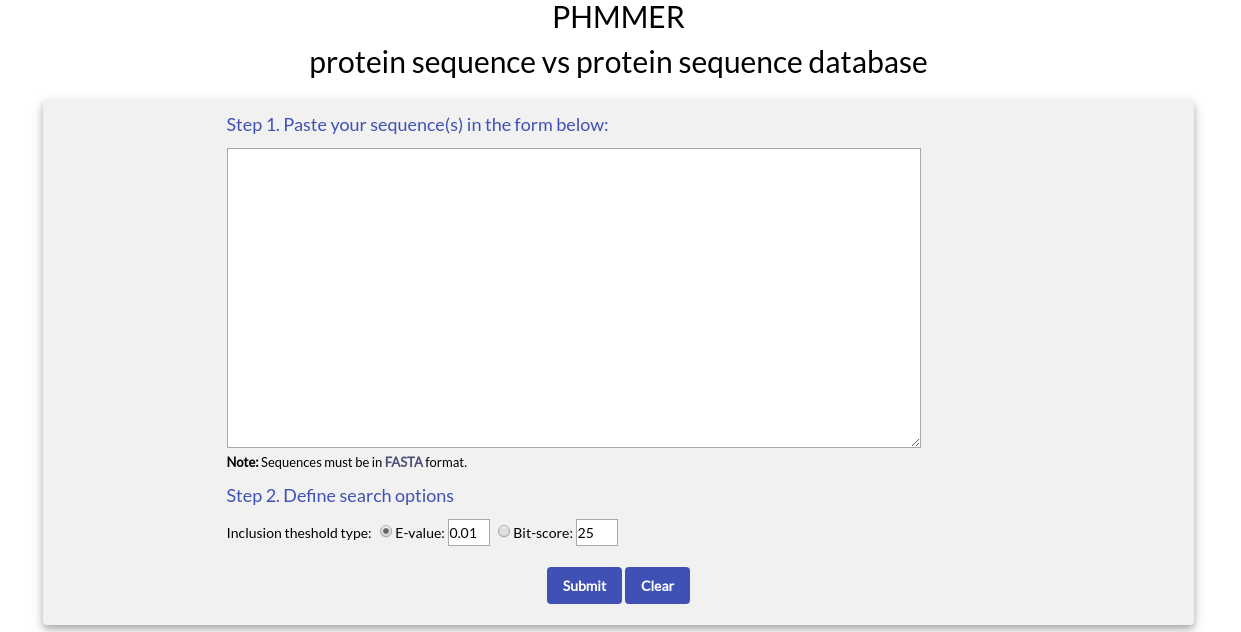
To use PHMMER you need to paste one or more sequences in FASTA format in the text box area.
In the "Define search options" section, you can choose the type and value of the inclusion threshold used during the search. The available options are the E-value (default) and the Bit-score. When you are ready, click the "Submit" button.
After the search is complete, you will be redirected to the PHMMER results page:
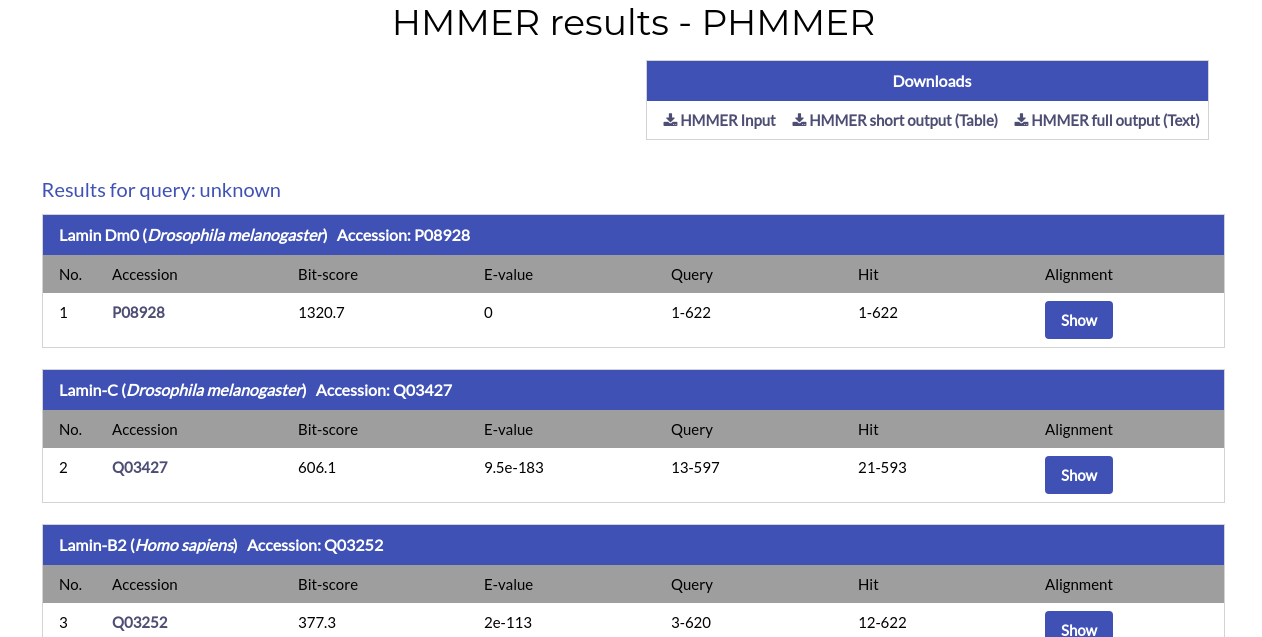
Similar to BLAST, the PHMMER results page shows all significant hits for your search. At the top of the page you will find links to download your sequence input, a short, easily parsable HMMER output in table format and the full HMMER results file.
For each alignment hit the name, species and Accession Code of the protein are given, alongside the alignment ranges for the query and hit, the Bit-score and E-value. By clicking the AC of the hit you will be redirected to its respective NucEnvDB page. By clicking the "Show" button under the "Alignment" column you can see the alignment for each hit:
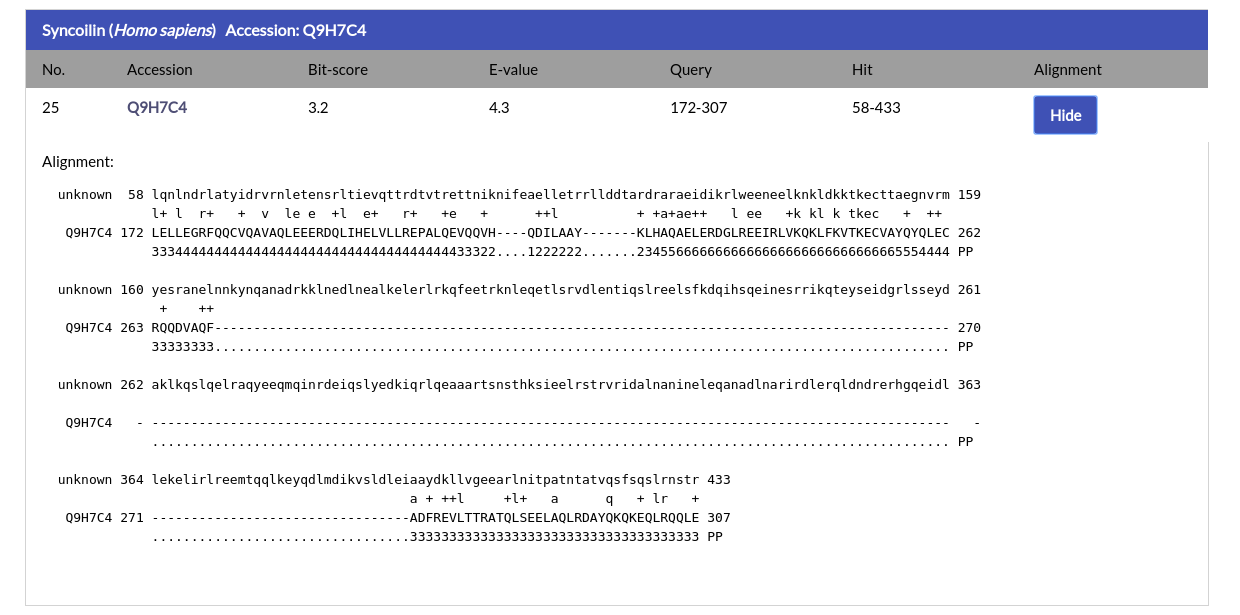
The alignment is given in the standard HMMER output format.
HMMSCAN Search
With HMMSCAN you can submit one or more amino acid sequences and perform a search against a profile HMM database, representing all the domains appearing in the protein entries of NucEnvDB. This database has been constructed using the profile HMMs of the domains, as obtained from the Pfam database.If you choose "HMMSCAN" from the top menu of the HMMER Search page you will see the following form:
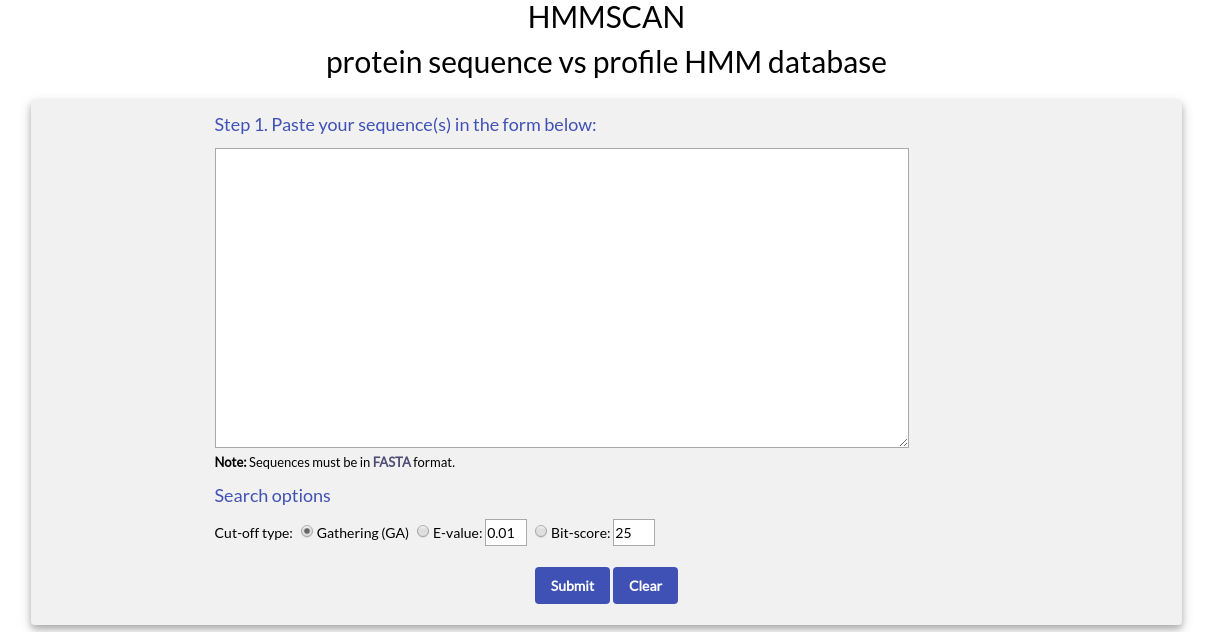
To use HMMSCAN you need to paste one or more sequences in FASTA format in the text box area.
In the "Define search options" section, you can choose the type of Cut-off to use during the search. Since the search will be performed against profile HMMs, you can use the Gathering cut-off (GA) of each profile HMM to filter results (default). The GA cut-off is a score threshold used in Pfam, manually assigned by each profile HMM's curator. GA thresholds are generally considered to be the reliable curated thresholds defining family membership; in Pfam, these thresholds define what gets included in Pfam Full alignments based on searches with Pfam Seed models.
Alternatively, you can choose to use the E-value or the Bit-score instead of GA.
After the search is complete, you will be redirected to the HMMSCAN results page:
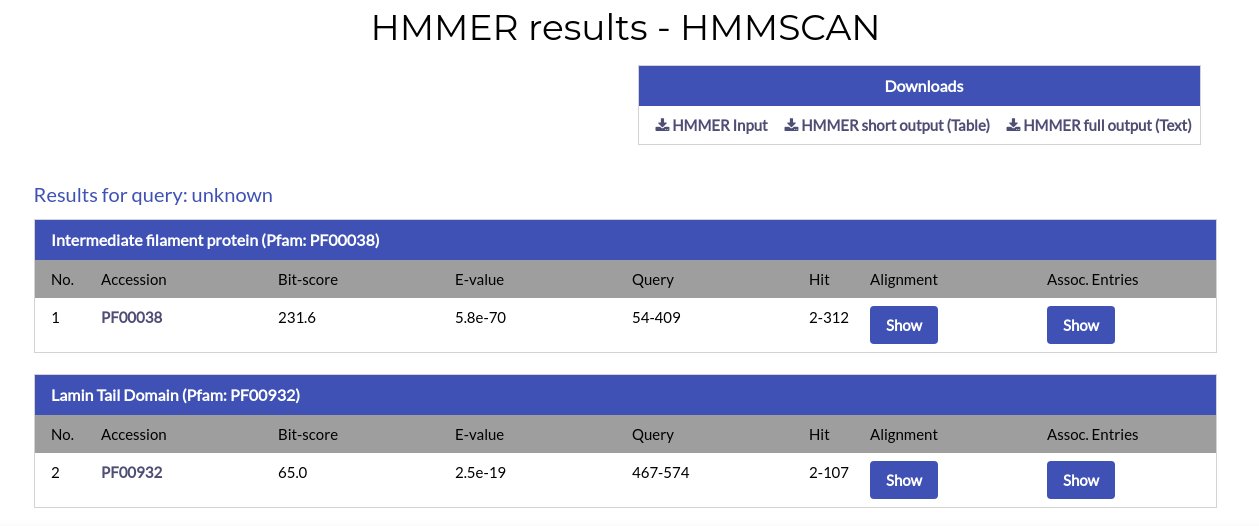
The HMMSCAN results page is similar to the PHMMER results page. However, each alignment hit corresponds to a domain rather than a protein.
For each hit the name of the domain and the Pfam accession code of its profile HMM are given. By clicking the accession code you will open a new window, leading to the domain's profile page in Pfam.
In addition to the above, the alignment ranges and the E-value and Bit-score values are given. The alignment between the query and the hit is also available and can be shown by clicking the "Show" button under the "Alignment" column:
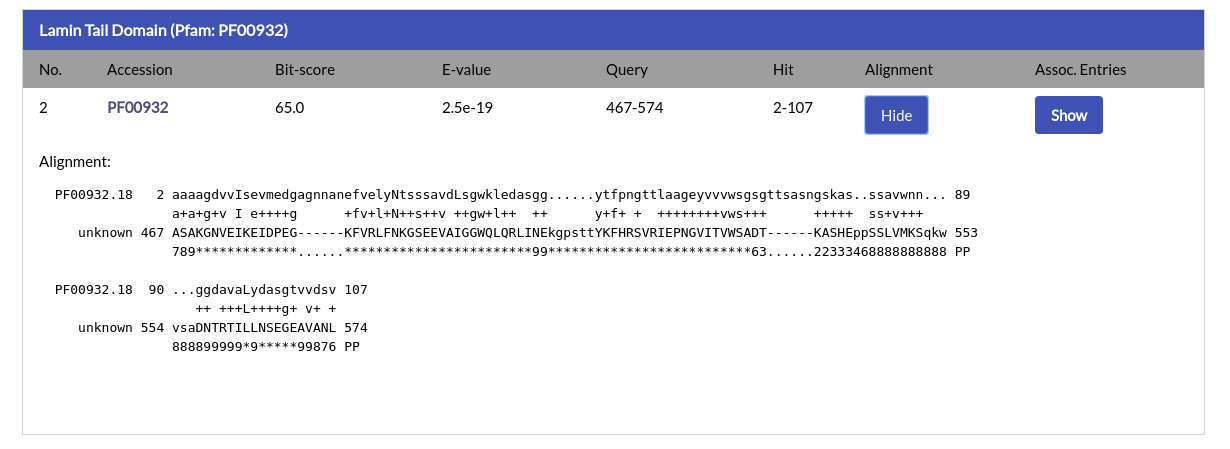
Finally, by clicking the "Show" button under the "Assoc. Entries" column you will automatically retrieve all NucEnvDB proteins that contain the domain of the alignment. This way you can easily find proteins that contain the same domains as your query sequence.
HMMSEARCH Search
With HMMSEARCH you can submit either a profile HMM or a multiple sequence alignment, representing a protein domain or protein family, and perform a search against NucEnvDB's sequences. This way, you can investigate whether any NucEnvDB proteins have common elements with the protein domain/family of your interest.If your input is a profile HMM, then the profile will be used "as-is" in the search. If your input is a multiple sequence alignment, it will first be used to construct a profile HMM with the HMMBUILD function of HMMER and the produced profile HMM will be used in the search.
If you choose "HMMSEARCH" from the top menu of the HMMER Search page you will see the following form:
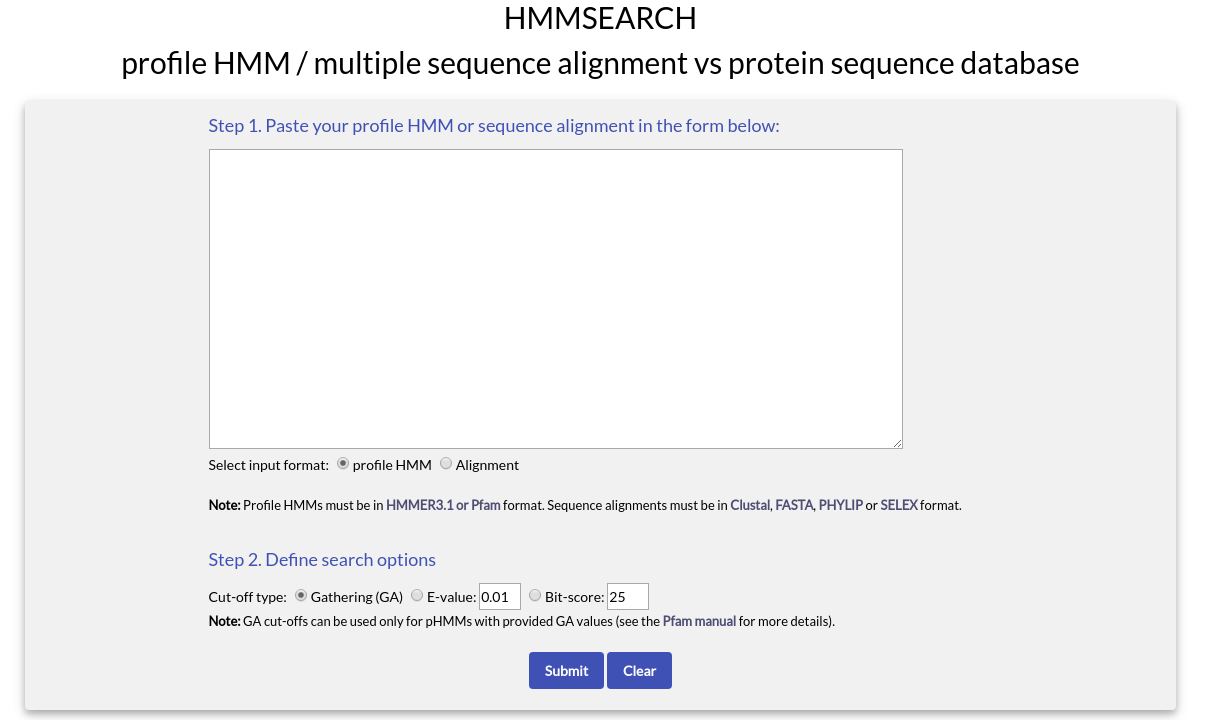
To use HMMSEARCH you need to paste either a profile HMM or a multiple sequence alignment in the text box area. In addition, you need to define your input type by choosing the appropriate option below the text box (profile HMM or alignment).
If the input is a profile HMM, then it must have the proper HMMER format used produced by HMMER 3.1 or above and used by Pfam. If the input is a multiple sequence alignment, then it must have at least four aligned sequences and be in one of the four most commonly used alignment formats (Clustal, FASTA, PHYLIP or SELEX).
In the "Define search options" section, you can choose the type of Cut-off to use during the search. Just like HMMSCAN, the options are the Gathering cut-off (GA), the E-value or the Bit-score. Note that the GA cutoff can be applied only if you have submitted a profile HMM with a defined GA value. If your profile doesn't have a defined GA value or if you submit a multiple sequence alignment, please choose one of the other two options (E-value or Bit-score).
A HMMERSEARCH example input using a profile HMM is shown below:
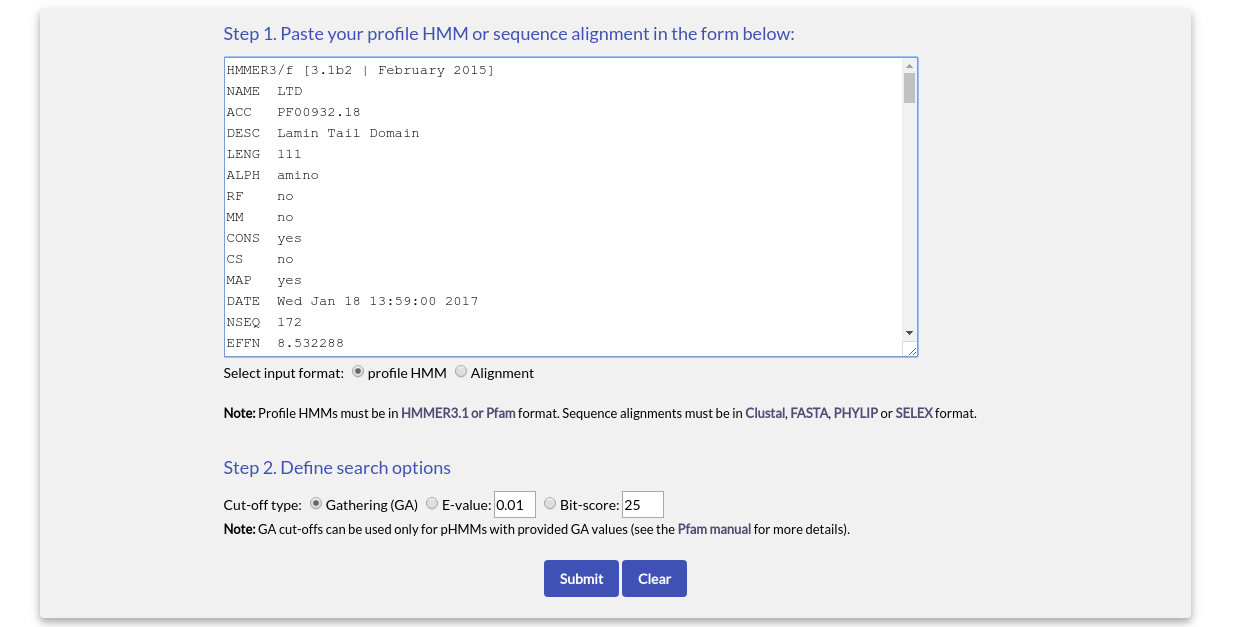
After the search is complete, you will be redirected to the HMMSEARCH results page:
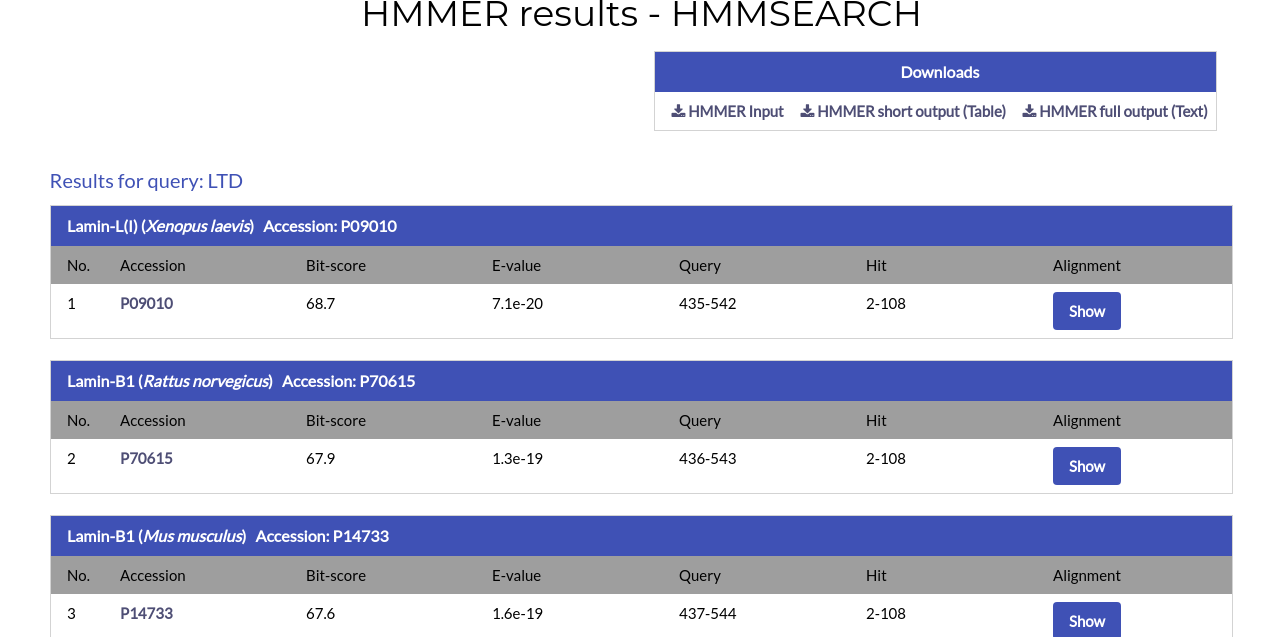
The results page is practically identical to the HMMSCAN results page. For each alignment hit the name, species and Accession Code of the protein are given, alongside the alignment ranges for the query and hit, the Bit-score and E-value. By clicking the AC of the hit you will be redirected to its respective NucEnvDB page. By clicking the "Show" button under the "Alignment" column you can see the alignment for each hit:

Interaction Network Analysis
NucEnvDB offers an automated pipeline for the creation, analysis and visualization of protein-protein interaction networks featuring the proteins of the Nuclear Envelope and their interacting partners. The pipeline utilizes Cytoscape.js, a JavaScript implementation of the popular Cytoscape network visualization suite for the construction and visualization of the networks, as well as NetworkX for the analysis of network components. In addition, the pipeline offers the option to perform network clustering using the Markov Cluster (MCL) algorithm, one of the most robust clustering methods commonly used in biological networks. The resulting network and its components can also be used to perform functional enrichment analysis, using NucEnvDB's own functional enrichment tool (see next section of the manual). Finally, all network analysis results are made available for download in file formats compatible with the desktop version of Cytoscape, allowing users to perform more advanced visualization and analysis procedures.
By choosing "Tools->Interaction Network Analysis" from the website's "Tools" menu, you will be redirected to the following page:
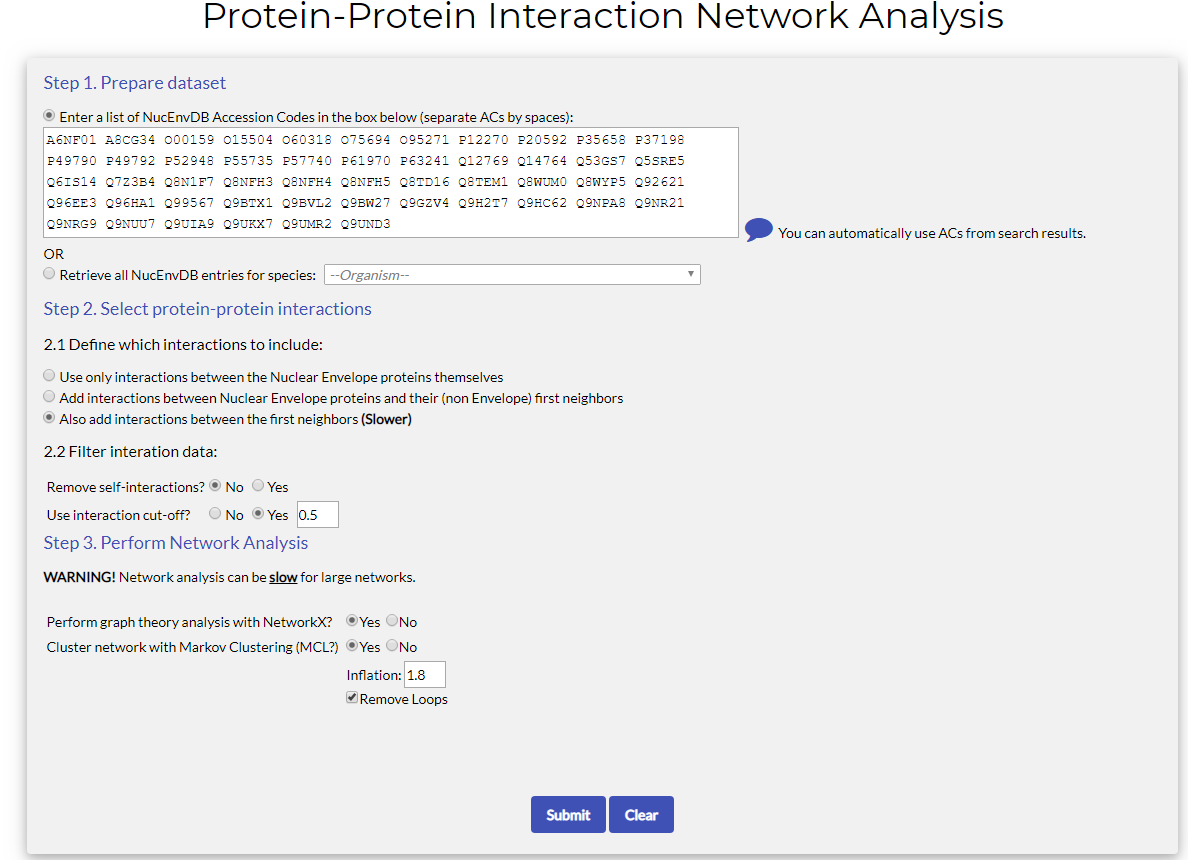
The tool form has the following fields:
- Step 1. Prepare Dataset:
In this field you have to define the initial input of Nuclear Envelope proteins (i.e. NucEnvDB entries), that will be used to search for interactions. Two options exist for this:- Manually enter a list of NucEnvDB Accession Codes: Fill the text box with the Accession Codes (ACs) of the proteins you would like to include in the initial dataset. Separate ACs by spaces.
Note that you can fill this field autoomatically, using the results of searches against the database (see the section "Searching NucEnvDB" for details, see also "Tutorial 1" below). - Automatically retrieve all entries for a species: choose this option if you want to create a network for all NucEnvDB entries of a specific organism. Select a species from the dropdown list (e.g. Mus musculus). NucEnvDB will automatically retrieve all entries of that species with known interactions.
- Manually enter a list of NucEnvDB Accession Codes: Fill the text box with the Accession Codes (ACs) of the proteins you would like to include in the initial dataset. Separate ACs by spaces.
- Step 2. Select protein-protein interactions:
In this step you define the types of interactions that will be used to construct the network. There are two fields that need to be defined:- 2.1 Define which interactions to include: In this field the user has to define what interactions will be used to construct the network. Three different options are offered:
- Use interactions between Nuclear Envelope proteins themselves: if this option is chosen, the network that will be constructed will include only Nuclear Envelope proteins and the interactions formed between them.
- Add interactions between Nuclear Envelope proteins and their (non Envelope) first neighbors (default): if this option is chosen, then the network will include interactions between the Nuclear Envelope proteins, as well as between Nuclear Envelope proteins and other partners, from other subcellular locations (e.g. the cytoplasm). This is a good option for checking what other interactions exist for the Envelope components. This is the default option of the pipeline.
- Also add interactions between the first neighbors (Slower): if this option is chosen, then the resulting network will not only contain all the interactions of the Nuclear Envelope's proteins, but also the interactions between the first neighbors. This option will produce the most complete and valid (from a biological standpoint) network. However, due to the increase in the data used, it is also the slowest.
- 2.2 Filter Interaction Data: In this field the user can filter the interaction data according to specific criteria, namely:
- Self-interactions: The user can choose whether to keep or remove protein self-interactions, i.e. interaction entries of proteins forming homodimer/homo-oligomer contacts (for example, the homo-polymerization of nucleoporins in the Nuclear Pore Complex). This can reduce the total number of interactions, however, note that homo-oligomerization is important for some components of the Nuclear Envelope (e.g. the Nuclear Lamina, or the Nuclear Pore Complex).
- Use Interaction Cut-off: All interaction data contained in NucEnvDB are scored using a confidence / reliability score, derived from the "Mi-score" value as set by the IntAct database. Generally speaking, interactions with higher score values are considered to be more reliable. If the user selects "yes", the interaction data used to construct the network can be filtered to keep only the interactions above the defined cut-off (default value is 0.5) and produce more reliable networks.
- 2.1 Define which interactions to include: In this field the user has to define what interactions will be used to construct the network. Three different options are offered:
- Step 3. Perform Network Analysis:
In this step you define whether the produced network will be subjected to analysis. This analysis includes the calculation of Graph Theory properties, performed with NetworkX, and/or network clustering, performed with MCL.
For graph theory analysis, all options are defined automatically by the pipeline. For MCL clustering, the Inflation value and the inclusion or exclusuion of network loops can be defined. For more information on these options, please refer to the MCL algorithm manual.
Note that network analysis can be slow for large networks.
Tutorial 1: Network Analysis of the human Nuclear Pore Complex
In this tutorial, we will create a protein-protein interaction network for the proteins of the human Nuclear Pore Complex (NPC). The initial dataset of the network will be retrieved from the results of an advanced search against NucEnvDB's entries. The network will be constructed using these proteins and their interactions with their first neighbors, as well as the interactions between the neighbors, in order to produce a "proper" biological network. Finally, Graph Theory Analysis and MCL clustering will be performed.
To start, use the "Advanced Search" page and perform a search for all human NPC proteins. This can be done simply by entering "Homo sapiens" in the Organism field (or 9606) and limiting the subcellular location options to "Nuclear Pore Complex". You can leave the rest of the fields as they are:
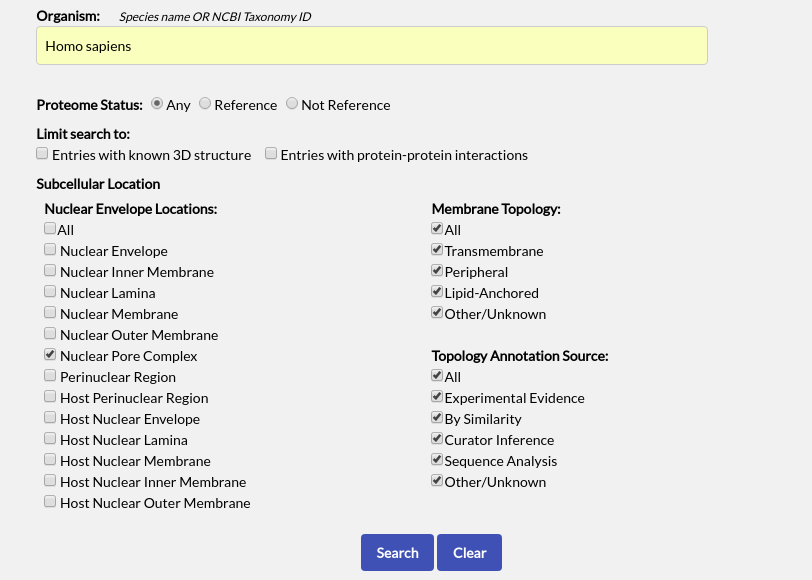
When the search results appear, select all entries using the checkbox at the top left of the table and click "Build Interaction Network":
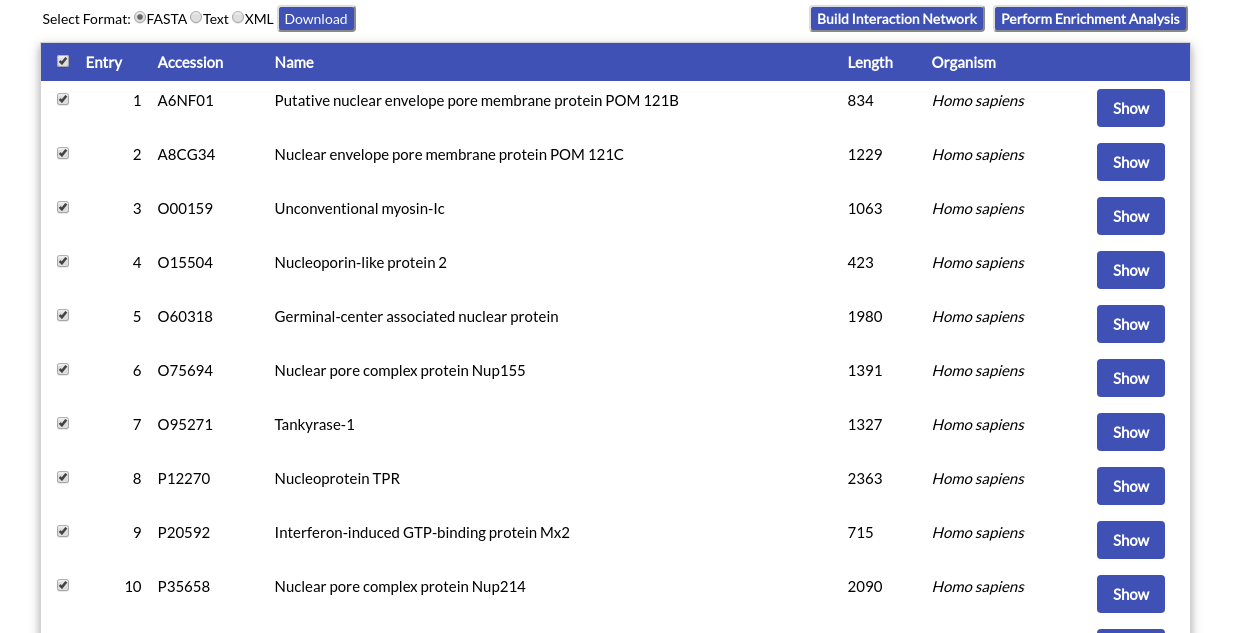
You will be redirected to the Network Analysis page. As you can see, the text box of Step 1 is already filled in with the ACs of the proteins you selected:

Now, in Step 2.1, choose the third option, "Also add interactions between the first neighbors (Slower)", to use the full set of interactions, i.e. NPC proteins with NPC proteins, NPC proteins with their first neighbors and interactions between the first neighbors as well.
In Step 2.2, leave the "Remove self-interactions?" option to "No". NPCs are formed by multiple copies of nucleoporins, therefore, homo-oligomerization interactions are important.
As for the second option, "Use interaction cut-off", choose "Yes" and set a cut-off value of 0.5 (the default). This will filter interaction data and keep all interactions that have a confidence score greater than or equal to 0.5.
Finally, in Step 3, make sure all both options are set to "Yes". This way, graph theory analysis and network clustering will be performed with NetworkX and MCL, respectively.
When you are ready, hit the "Submit" button. You will see the following message, indicating that your job has started.
As you can see, your job has received a numerical ID. You can use this ID to retrieve your results from the "Retrieve Results" form (see Tutorial 4 below). Depending on the size of the network, the analysis requested and the server load, your job may take a few minutes to finish. After it is done, the results page will load.
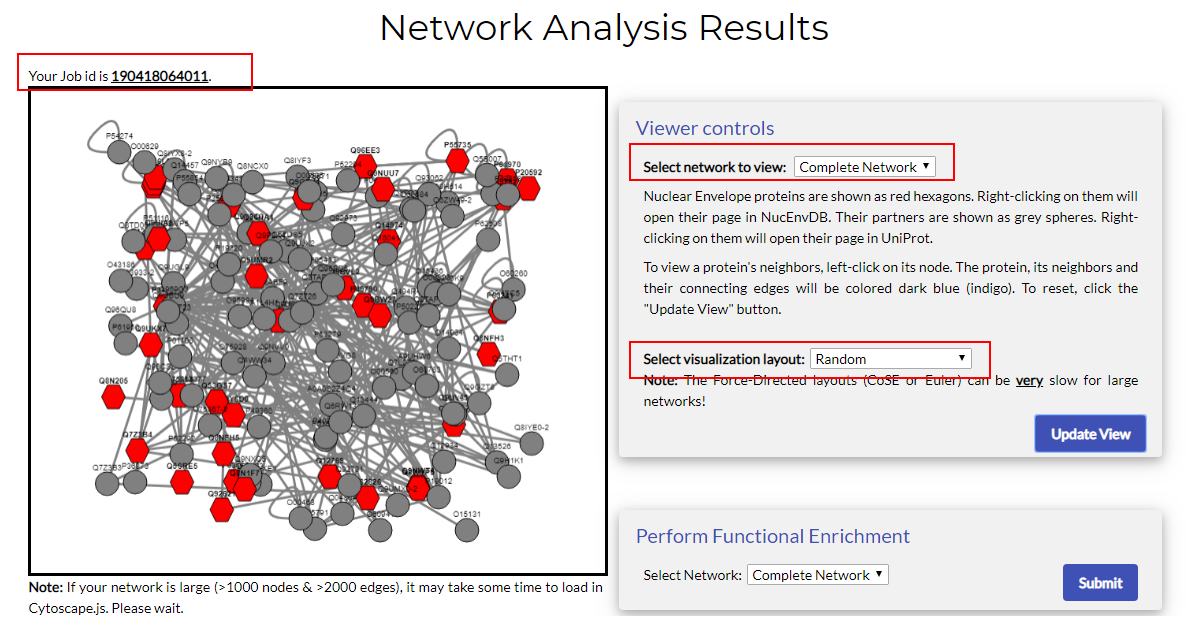 The first part of the results page is the network viewer. At the top left side, you will see your job's ID. The left panel contains the viewing window that displays your network, while the right panel contains the viewer's control options and description.
NucEnvDB utilizes Cytoscape.js, a JavaScript version of Cytoscape, to create network visualizations. Therefore, in order for the viewer to be functional, JavaScript needs to be enabled in your browser.
The viewer panel contains your network, with proteins represented as nodes and interactions represented as edges. Nodes corresponding to Nuclear Envelope proteins are shown as red hexagons, while nodes representing their neighbors are shown as grey circular discs.
You can use the mouse to navigate the network panel. Hold the left button and drag the mouse to drag your network in the viewer. Zoom in and out, using the middle scroll button.
To view a protein's interacting neighbors, left-click on its node. The protein, its neighbors and the connecting edges will be colored dark blue (indigo).
To view more information on a protein, simply right-click on its node. In nodes representing Nuclear Envelope proteins, right-clicking will open their page in NucEnvDB, while for nodes corresponding to neighbors, right-clicking will open their page in UniProt.
The viewer controls contain two main options:
- Select network to view: use the drop-down list to select the network you wish to visualize. There are two choices, the "Complete Network", showing the entire network, and "Top MCL Clusters", showing the first 10 network clusters, as produced by MCL. Note that this option is available only when MCL clustering has been set to "Yes" in the input form. If no clustering has been performed, only the Complete Network has been created.
- Select visualization layout: use the drop-down list to select the layout that you wish your network to have.
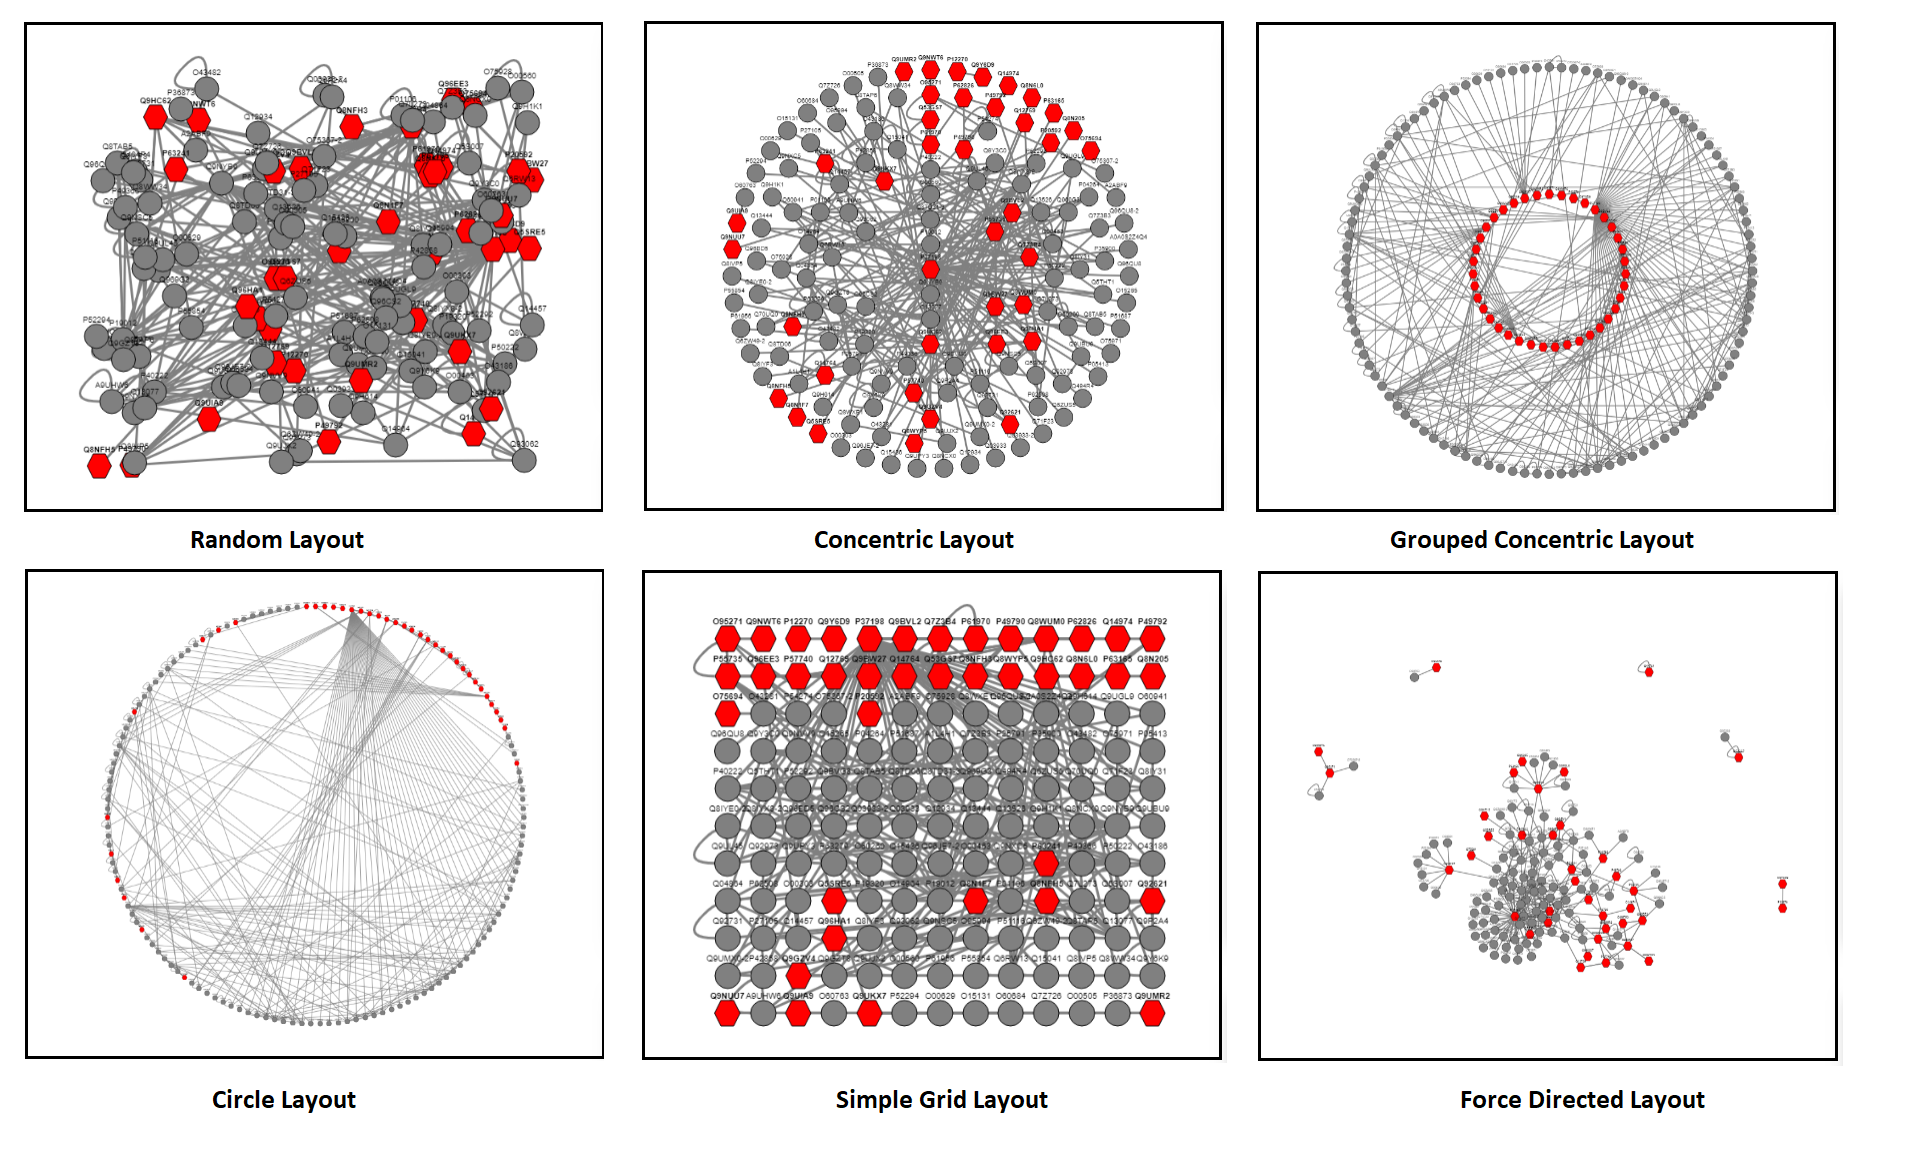
The NucEnvDB viewer currently supports seven different layouts (examples are shown in the following figure). The "Random" layout distributes nodes randomly (this is the default). The "Concentric" layout groups nodes based on their node degree values into different layers. The "Grouped Concentric" is similar, however, grouping is done by aggrefating all Nuclear Envelope nodes in the inner layer and all their neghbors in the outer layer. "Circle" applies a circular layout. "Simple Grid", as the name suggests, creates a simple (albeit "ugly") grid organization. Finally, the two "Force Directed" layouts create force-directed organization schemes, similar to those of the desktop version of Cytoscape, using two different algorithms, CoSE and Euler. Note that the two Force-Directed layouts are computationally intensive, and can be rather slow when applied to large networks.
Functional Enrichment Analysis
NucEnvDB's functional enrichment analysis tool utilizes WebGestaltR, an implementation of the Web-based GEne SeT Analysis Toolkit (WebGestalt) in the R programming language.
Enrichment is performed through Over-Representation Analysis (ORA), a technique for determining if a set of categories are present more than would be expected (over-represented) in the dataset. Currently, enrichment can be performed using the following four types of evidence:
- Gene Ontology terms: Find which GO terms are over-represented in your Nuclear Envelope dataset.
- Metabolic Pathways: View the metabolic pathways in which your Nuclear Envelope proteins participate.
- Disease Annotation: Reveal associations between Nuclear Envelope proteins and diseases (Note: This option is currently available only for Homo sapiens).
- Drug Binding: View protein-drug interactions associated with Nuclear Envelope proteins (Note: This option is currently available only for Homo sapiens).
By choosing "Tools->Functional Enrichment" from the website's "Tools" you will be redirected to the following page:
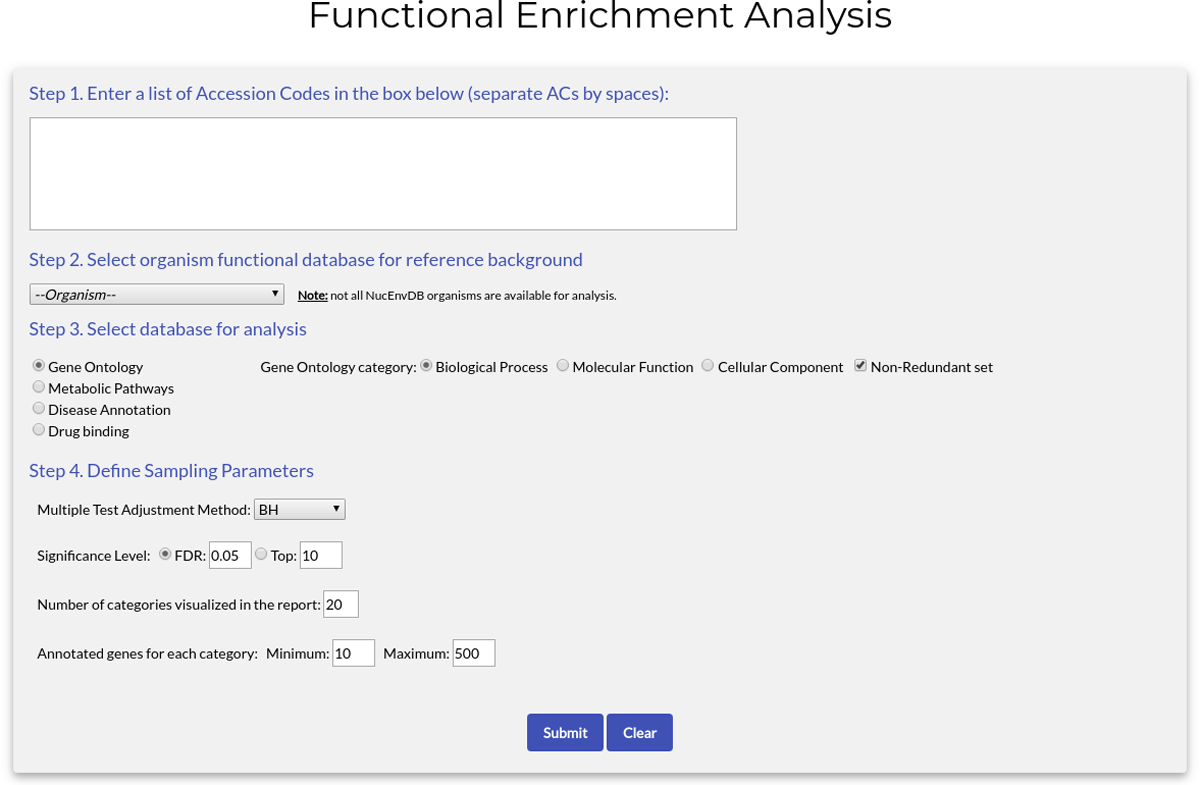
The form has the following fields:
- Step 1. Prepare Dataset:
- Fill the text box with the Accession Codes (ACs) of the proteins you would like to analyze. Separate ACs by spaces.
- You can also automatically retrieve a list of ACs for the tool using the "Perform Functional Enrichment" button in the "Browse Proteins" or "Search results" pages (see previous sections, also the tutorial that follows).
- Step 2. Select organism database for reference background: use the dropdown menu to select your organism from a list of 12 species.
- Step 3. Select database for analysis: choose what type of evidence you would like to enrich your data with. Currently available options are:
- Gene Ontology. You can choose any of the three types of GO terms for enrichment. If the option "Non-Redundant set" is checked, the ontology terms used will be filtered to exclude too closely related terms and/or redundant entries in the Gene Ontology database.
- Metabolic Pathways. You can retrieve pathway information from KEGG or REACTOME. Note that REACTOME pathways are not available for Arabidopsis thaliana and Sus scrofa.
- Disease Annotation. You can choose DisGeNet or OMIM as your source of information. This option is available only for Homo sapiens proteins.
- Drug binding. Information on drug binding is retrieved from DrugBank. This option is available only for Homo sapiens proteins.
- Step 4. Define sampling parameters: In the following fields you will define the sampling options of your analysis.
- Multiple Test Adjustment Method. As WebGestaltR tests multiple gene/protein sets at the same time, their P-values need to be adjusted. For this reason, an adjustment method is used. The methods supported by WebGestalt currently are:
- BH (default). The False Discovery Rate (FDR) method, as originally implemented by Benjamini and Hochberg.
- BY. The FDR method, as implemented in the Benjamini–Hochberg–Yekutieli procedure.
- Bonferroni. The Bonferroni correction.
- Holm. The Holm procedure.
- Hommel. The Hommel multiple test procedure
- Significance Level. In this option you choose the method through which statistically significant categories are identified. Two options are currently offered:
- FDR (default). The enriched categories are identified based on the set FDR threshold (default value: 0.05).
- Top. The enriched categories are first ranked based on the applied FDR adjustment. The top ranked categories (default value: 10) are then chosen.
- Number of categories visualized in the report. The final number of categories reported in the enrichment results (default value: 20).
- Annotated genes for each category. The minimum (default: 10) and maximum (default: 500) number of genes that a category must have in the final report. Any categories with less genes than the minimum or more genes than the maximum will be excluded.
- Multiple Test Adjustment Method. As WebGestaltR tests multiple gene/protein sets at the same time, their P-values need to be adjusted. For this reason, an adjustment method is used. The methods supported by WebGestalt currently are:
Tutorial
Now follows a tutorial showcasing the use of the Functional Enrichment Analysis tool. In this tutorial, we will perform GO enrichment analysis for all human proteins forming the Nuclear Pore Complex.
To start, use the "Advanced Search" page and perform a search for all human NPC proteins. This can be done simply by entering "Homo sapiens" in the Organism field (or 9606) and limiting the subcellular location options to "Nuclear Pore Complex". You can leave the rest of the fields as they are:

When the search results appear, select all entries using the checkbox at the top left of the table and click "Perform Enrichment Analysis":

You will be redirected to the Functional Enrichment Analysis page. As you can see, the text box of Step 1 is already filled in with the ACs of the proteins you selected.
Proceed to select Homo sapiens from the Dropdown in Step 2:

Now select the type of data you want to use in your enrichment analysis. For this tutorial, choose "Gene Ontology" and "Molecular Function". Make sure "Non-Redundant set" is also checked to remove redundant entries:

The rest of the settings can be left at their original values. When you are ready, click "Submit" to begin the analysis.
The "Enrichment Analysis Results" page has four tabs, "Summary", "User ID Mapping Table", "GOSlim Summary" and "Enrichment Results".
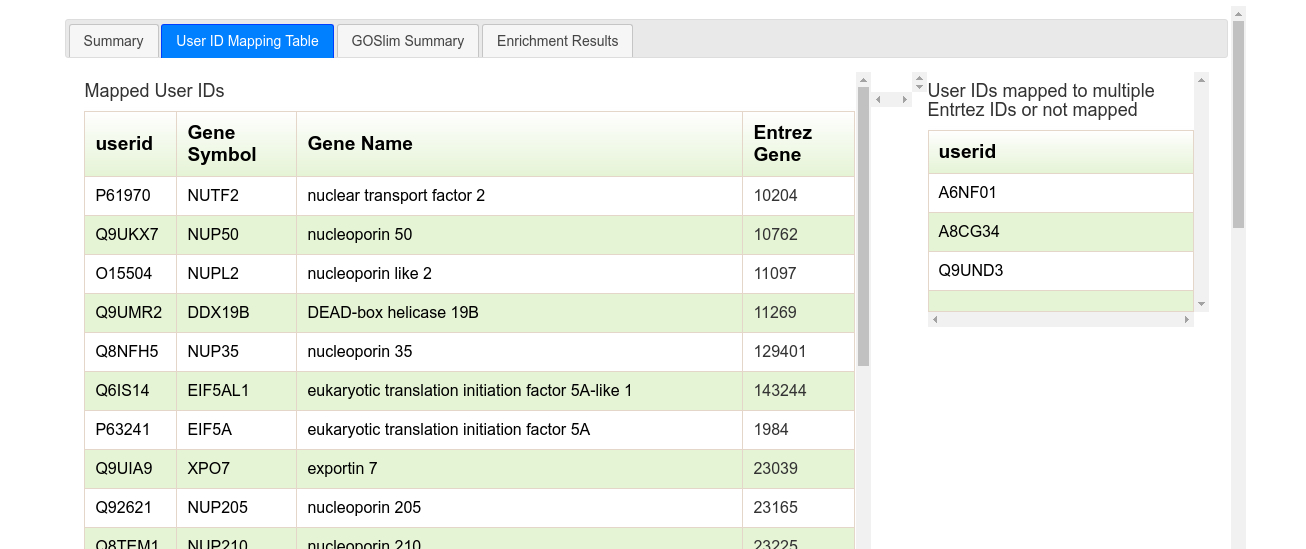
The first tab ("Summary") offers the summarized information on your analysis, including the categories analyzed, the sampling methods used, the number of enriched genes etc. In addition, a link ("Result Download") providing a zipped file with all analysis results is offered.
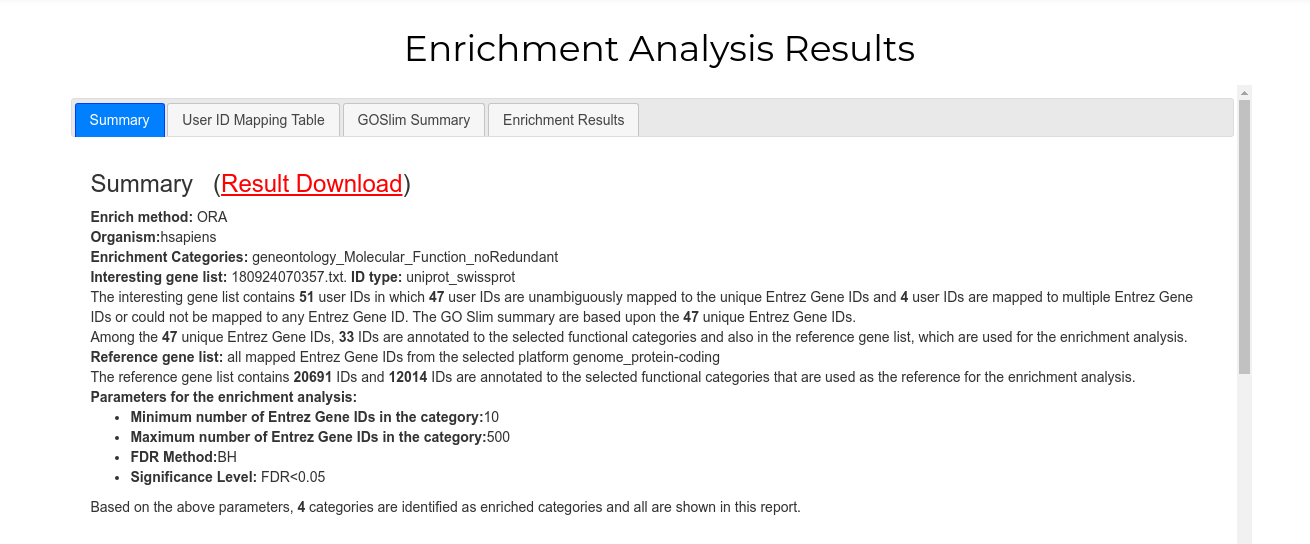
The second tab ("User ID Mapping Table") shows two tables. The table on the left presents all Accession Codes that were mapped to unique Entrez Gene IDs and were used in the enrichment analysis. Clicking on the Entrez ID will open a new browser window to the equivalent NCBI Gene page. The table on the right is the list of ACs that were either mapped to multiple Entrez IDs or not mapped at all, and were excluded from analysis.
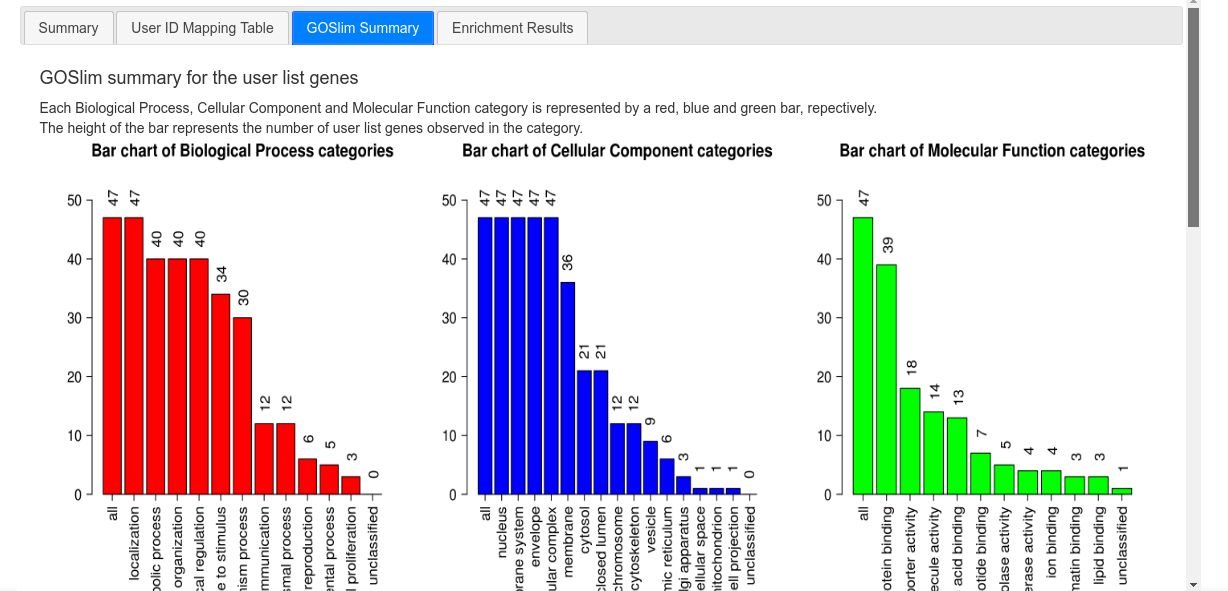
The third tab ("GOSlim Summary") shows three bar charts with the general distribution of GO terms (Biological Processes, Molecular Functions and Cellular Components) for the enriched gene list.
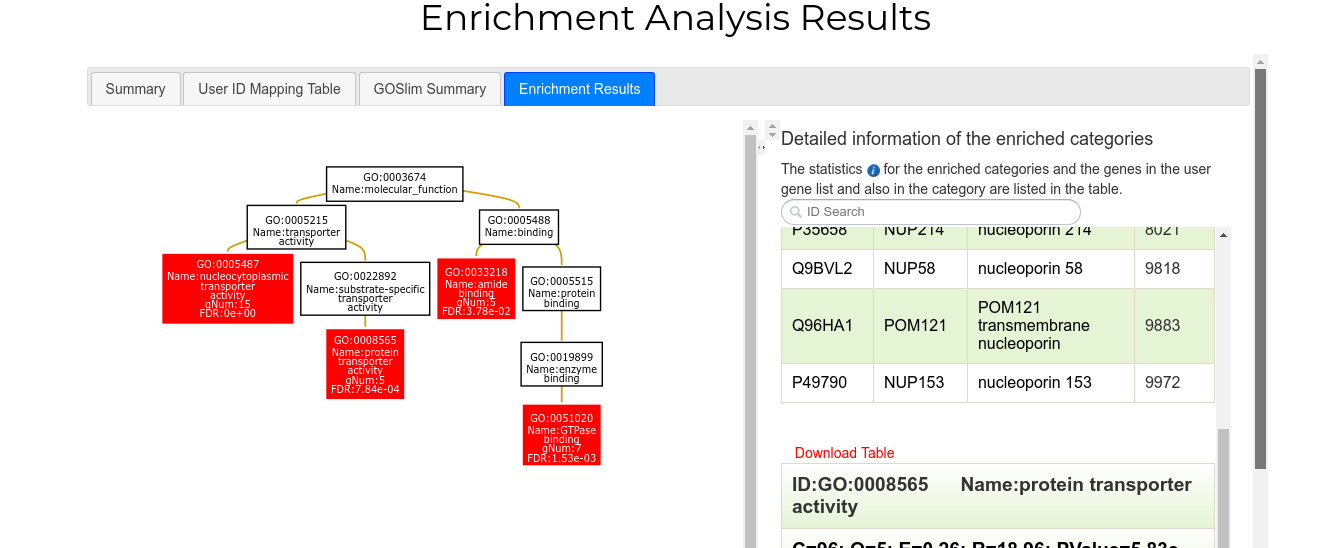
Finally, the fourth tab ("Enrichment Results") shows the results of the enrichment analysis. On the left side there is a network representation of enriched categories. Terms with statistically significant values are colored red. On the right side, a sliding section with the tables corresponding to each enriched category appears. Each table shows the id and name of the category, its statistics in the analysis (P-value, FDR rate etc) and a list with all associated proteins/genes.
If you choose to perform analysis on another data type (e.g. "Metabolic Pathways"), only the last tab will change. This is the "Enrichment Results" tab of an analysis performed on KEGG metabolic pathways for the same dataset:
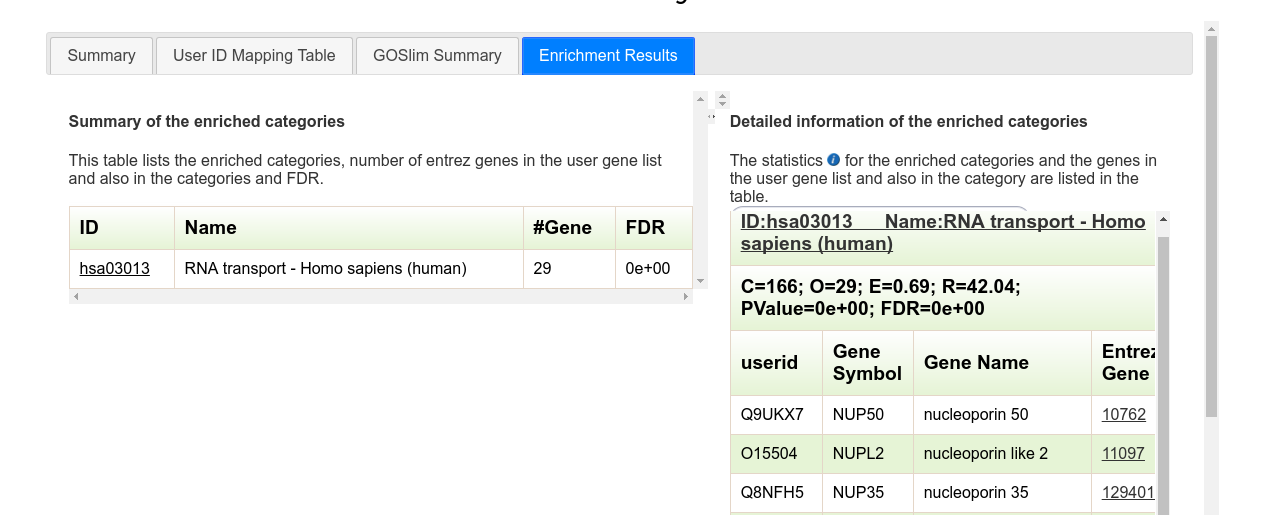
The left side of the panel now shows a table with all associated metabolic pathways for the dataset (one in this instance). Clicking on the pathway id will redirect you to its respective KEGG page.
Downloads
The "Downloads" page offers links to download the data contained in NucEnvDB in Text, FASTA or XML format. In addition to the full database, you can also download subsets of NucEnvDB entries, clustered based on their % sequence identity.
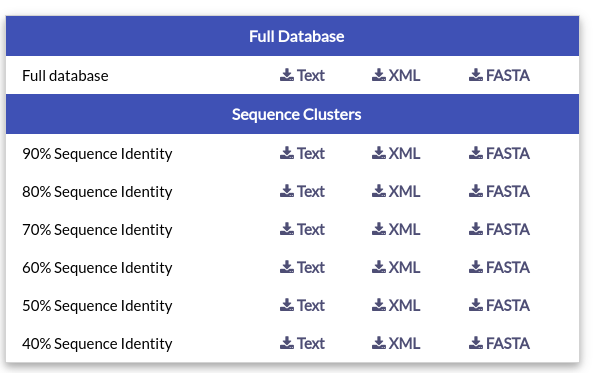
Sequence clusters were created using CD-HIT.
Privacy
NucEnvDB collects some user data to successfully provide its services. For more information, please consult the service's privacy notice.
Technologies
NucEnvDB is based on modern technologies. Users should have JavaScript enabled in their browser settings to achieve full functionality.
NucEnvDB's visualization and analysis features are powered by these freely available resources:
- 3D structure visualization is performed using the LiteMol viewer.
- Sequence searches are performed using BLAST+ and HMMER 3.2.
- Network analysis and visualization are performed using Cytoscape.js, NetworkX and the Markov Cluster algorithm.
- Functional enrichment analysis is performed using WebGestaltR.

